


In the data-rich landscape of modern marketing, it's easy to get lost in a sea of numbers. Likes, shares, and impressions can feel good, but they often don't tell the whole story. To build a sustainable and profitable strategy, you need to focus on what truly matters: marketing performance metrics that directly connect your efforts to business outcomes. Understanding these key indicators is the difference between simply being busy and being effective.
This guide cuts through the noise, presenting eight essential marketing performance metrics examples. We'll break down not just what they are, but how to calculate them, why they matter, and how to use them to make smarter decisions that justify your budget. While these metrics apply broadly, companies adopting a product-led approach may also need to track specific Product Led Growth Metrics to monitor user behavior and drive self-serve adoption.
From understanding customer acquisition costs to proving the value of your ad spend with ROAS, these are the KPIs that will empower you to optimize your strategy. Let's dive in and transform your data into a powerful tool for success.
1. Customer Acquisition Cost (CAC)
Customer Acquisition Cost (CAC) is a critical metric that reveals exactly how much your business spends to gain a single new customer. Calculated by dividing your total sales and marketing expenses by the number of new customers acquired in a specific period, CAC is a direct measure of your marketing campaign efficiency and business model sustainability. It's one of the most fundamental marketing performance metrics examples for any growing company.
Strategic Analysis & Application
A low CAC indicates an efficient, profitable acquisition strategy, while a high CAC can signal a need to re-evaluate your channels or tactics. For instance, HubSpot strategically analyzes CAC for each marketing channel, from paid search to content marketing. This allows them to allocate their budget more effectively, investing more in channels with a lower CAC and higher customer quality, thereby optimizing their overall marketing mix. Similarly, early in its growth, Dropbox implemented a viral referral program that dramatically reduced its CAC by turning existing users into brand advocates.
Key Insight: The true power of CAC lies in its relationship with Customer Lifetime Value (LTV). A healthy business model typically features an LTV that is at least three times its CAC (LTV:CAC ratio of 3:1).
Actionable Tips for Implementation
To effectively leverage CAC, move beyond a single, blended number.
- Segment Your CAC: Calculate CAC by individual marketing channel (e.g., Google Ads, SEO, social media) to identify your most profitable sources of new customers.
- Include All Costs: For an accurate "fully-loaded" CAC, factor in all related expenses: ad spend, tool subscriptions, agency fees, and the salaries of your marketing and sales teams.
- Track Over Time: Analyze CAC trends on a monthly or quarterly basis. A rising CAC might indicate market saturation or campaign fatigue, while a falling CAC shows improved efficiency.
2. Return on Advertising Spend (ROAS)
Return on Advertising Spend (ROAS) is a direct, revenue-focused metric that calculates the gross revenue generated for every dollar spent on an advertising campaign. Calculated by dividing the total revenue from an ad campaign by the total cost of that campaign, ROAS provides a clear view of which advertising efforts are most financially productive. It is one of the most vital marketing performance metrics examples for any business looking to optimize its paid media budget.
Strategic Analysis & Application
A high ROAS indicates a profitable ad campaign, while a low ROAS suggests that the costs are outweighing the immediate returns. For example, Warby Parker famously achieved an 8:1 ROAS on Facebook ads by leveraging highly specific lookalike audiences built from their most valuable customer segments. This allowed them to reach new, high-intent buyers with remarkable efficiency. Similarly, Dollar Shave Club's legendary viral video campaign reportedly achieved an incredible ROAS of over 20:1 in its first year by combining low production costs with massive organic reach, proving that creative can be a powerful ROAS multiplier.
Key Insight: ROAS is a tactical metric that measures gross revenue, not net profit. A "good" ROAS depends entirely on your profit margins. A business with 80% margins might thrive on a 3:1 ROAS, while a business with 20% margins would lose money with the same result.
Actionable Tips for Implementation
To use ROAS effectively, you must look beyond a simple, blended average.
- Set Dynamic Targets: Don't use a single ROAS goal for all campaigns. Set higher targets for bottom-of-funnel campaigns (e.g., retargeting) and lower, more flexible targets for top-of-funnel brand awareness initiatives.
- Align Attribution Windows: Ensure your ad platform's attribution window (e.g., 7-day click, 1-day view) matches your business's typical sales cycle. A mismatch can lead to under- or over-reporting of your true ROAS.
- Track Channel-Specific ROAS: Analyze ROAS for each platform (Google Ads, Facebook, TikTok) to understand where your ad spend is working hardest. For social media campaigns specifically, you can learn more about how to measure social media success on postsyncer.com to refine your approach.
3. Marketing Qualified Leads (MQL)
A Marketing Qualified Lead (MQL) is a prospective customer who has shown significant interest in your brand based on their marketing interactions but isn't quite ready for a sales conversation. This metric is defined by specific criteria, such as downloading an ebook, requesting a demo, or repeatedly visiting key website pages. Tracking MQLs is crucial for aligning sales and marketing teams, ensuring that marketing efforts generate a pipeline of genuinely interested prospects. This makes it one of the most essential marketing performance metrics examples for B2B and high-consideration B2C companies.
Strategic Analysis & Application
The MQL serves as a critical handoff point between marketing and sales. A well-defined MQL process prevents the sales team from wasting time on cold leads and allows marketing to nurture prospects effectively. For example, Salesforce combines demographic data with engagement levels to define its MQLs; a lead must meet certain company size and role criteria and achieve a behavior score over 50 before being passed to sales. Similarly, Marketo famously improved its sales team's productivity by over 30% simply by refining and tightening its MQL criteria, ensuring sales reps only engaged with the most promising leads.
Key Insight: The ultimate goal of an MQL is to become a Sales Qualified Lead (SQL). The MQL-to-SQL conversion rate is the true test of your lead qualification quality and marketing-sales alignment.
Actionable Tips for Implementation
To make your MQL metric meaningful, focus on quality and alignment rather than just volume.
- Co-create Criteria with Sales: Regularly meet with the sales team to review and update MQL criteria. Their on-the-ground feedback is invaluable for understanding which lead characteristics actually correlate with successful deals.
- Implement Lead Scoring: To accurately identify and prioritize Marketing Qualified Leads (MQLs), many organizations leverage lead scoring software to pinpoint the hottest, most qualified prospects. Assign points for demographic attributes (like job title or industry) and behavioral actions (like page views or email opens).
- Track Conversion Down the Funnel: Don't stop at tracking the number of MQLs. Monitor the MQL-to-SQL rate and, ultimately, the MQL-to-customer conversion rate to validate that your marketing activities are driving real business results.
4. Customer Lifetime Value (CLV or LTV)
Customer Lifetime Value (CLV or LTV) is a predictive metric representing the total net profit a business can expect from a single customer throughout their entire relationship. By shifting focus from a single transaction to the long-term profitability of a customer, CLV provides a strategic lens for decisions on marketing spend, customer retention, and product development. It is an essential component in any serious discussion of marketing performance metrics examples, offering a vital counterpoint to acquisition-focused metrics.
Strategic Analysis & Application
A high CLV signifies strong customer loyalty, product satisfaction, and successful retention strategies. For example, Amazon's Prime membership is a masterclass in maximizing CLV. By bundling free shipping, streaming content, and other perks, Amazon increases transaction frequency and deepens customer loyalty, ensuring subscribers spend significantly more than non-Prime members over their lifetime. Similarly, Starbucks utilizes its highly successful Rewards program to analyze purchasing habits and encourage repeat visits, directly boosting the lifetime value of each app user through personalized offers and incentives.
Key Insight: CLV contextualizes acquisition spending. Knowing what a customer is worth over their lifetime allows you to determine how much you can afford to spend to acquire them, making it the perfect partner metric for Customer Acquisition Cost (CAC).
Actionable Tips for Implementation
To properly integrate CLV into your strategy, you need a granular and dynamic approach.
- Segment Your CLV: Don't rely on a single, average CLV. Calculate it for different customer segments based on acquisition channel, first product purchased, or demographic data to identify your most valuable cohorts.
- Factor in Profitability: A true CLV calculation should be based on profit, not just revenue. Subtract the costs of goods sold and servicing expenses to understand the real long-term worth of a customer.
- Update Calculations Regularly: Customer behavior, product pricing, and market conditions change. Re-calculate CLV quarterly or semi-annually to ensure your strategic decisions are based on current, relevant data.
5. Conversion Rate
Conversion Rate measures the percentage of users who complete a desired action, from a macro goal like a purchase to a micro goal like a newsletter signup. Calculated by dividing the number of conversions by the total number of visitors and multiplying by 100, this metric directly evaluates the effectiveness of your website, landing pages, and marketing campaigns. It is a cornerstone among marketing performance metrics examples for gauging how well you persuade prospects to act.

Strategic Analysis & Application
A high conversion rate signifies a compelling offer and a seamless user experience, while a low rate points to friction in the customer journey. For example, Unbounce leverages targeted landing page optimization, often increasing client conversion rates by over 30% by tailoring messaging and design to specific ad campaigns. Similarly, the Obama for America 2012 campaign famously used rigorous A/B testing on its donation pages. By systematically testing different button text and media, they found a combination that improved donation conversion rates by a staggering 49%.
Key Insight: Small changes can yield massive results. Expedia discovered that removing a single, non-essential form field ("Company Name") from their booking process increased annual profit by $12 million. This highlights how minor friction can have a major impact on conversions.
Actionable Tips for Implementation
To meaningfully improve your conversion rate, you need a granular and qualitative approach.
- Segment Your Rates: Analyze conversion rates by traffic source, device type, and user demographic. This will reveal which channels and audiences are performing best and where optimization is most needed.
- Track Micro-Conversions: Don't just focus on the final sale. Track smaller steps like video views, PDF downloads, or "add to cart" actions. Optimizing these micro-conversions can lead to significant gains in macro-conversions.
- Use Statistical Significance: When A/B testing, ensure your results are statistically significant before declaring a winner. This prevents you from making business decisions based on random chance rather than true user preference.
6. Brand Awareness Metrics
Brand awareness metrics measure how familiar and recognizable your brand is within your target audience. Gauged through methods like surveys asking for unaided recall (naming a brand without a prompt) or aided recall (recognizing a brand from a list), these metrics are crucial for assessing the impact of top-of-funnel marketing activities. Unlike direct-response metrics, brand awareness provides a view into long-term brand equity and market presence, making it one of the most foundational marketing performance metrics examples for sustainable growth.
Strategic Analysis & Application
Strong brand awareness creates a powerful competitive advantage, influencing purchase decisions long before a customer is actively in-market. For example, Coca-Cola meticulously tracks brand recognition and sentiment across global markets to maintain its legendary status, adjusting campaigns to resonate with local cultures while keeping its core brand identity consistent. In the startup world, Dollar Shave Club used memorable viral video campaigns to skyrocket its unaided brand awareness among young men, disrupting a market dominated by established giants. By focusing on awareness, they built a brand that people talked about, which directly fueled their acquisition funnel.
Key Insight: Brand awareness is not just a vanity metric; it directly correlates with market share and pricing power. Stronger brand recall often leads to higher consumer trust and a greater willingness to pay a premium.
Actionable Tips for Implementation
To effectively measure and grow brand awareness, you need a multi-faceted approach. For those looking to dive deeper, you can learn more about how to increase brand awareness on social media on Postsyncer.com.
- Use Diverse Measurement Tools: Combine direct surveys (aided/unaided recall) with indirect digital metrics like branded search volume, social media mentions, and direct website traffic to get a holistic view.
- Segment Your Audience: Don't just measure overall awareness. Analyze how well your brand is known within specific target demographics, geographic regions, or customer personas to identify strengths and weaknesses.
- Track Competitor Awareness: Benchmark your brand's performance against key competitors. Understanding your "share of voice" in the market provides critical context for your own awareness levels and growth trends.
7. Marketing Attribution Model Performance
Marketing attribution model performance evaluates how different marketing touchpoints contribute to conversions throughout the customer journey. Analyzing various attribution models, such as first-touch, last-touch, and multi-touch, helps marketers understand which channels are most effective at different stages. This is one of the most sophisticated marketing performance metrics examples, allowing for a nuanced understanding of your marketing mix's true impact on revenue.
This infographic illustrates a simplified comparison of how different models might assign credit for a single conversion, showing the shift in perspective from single-touch to multi-touch analysis.
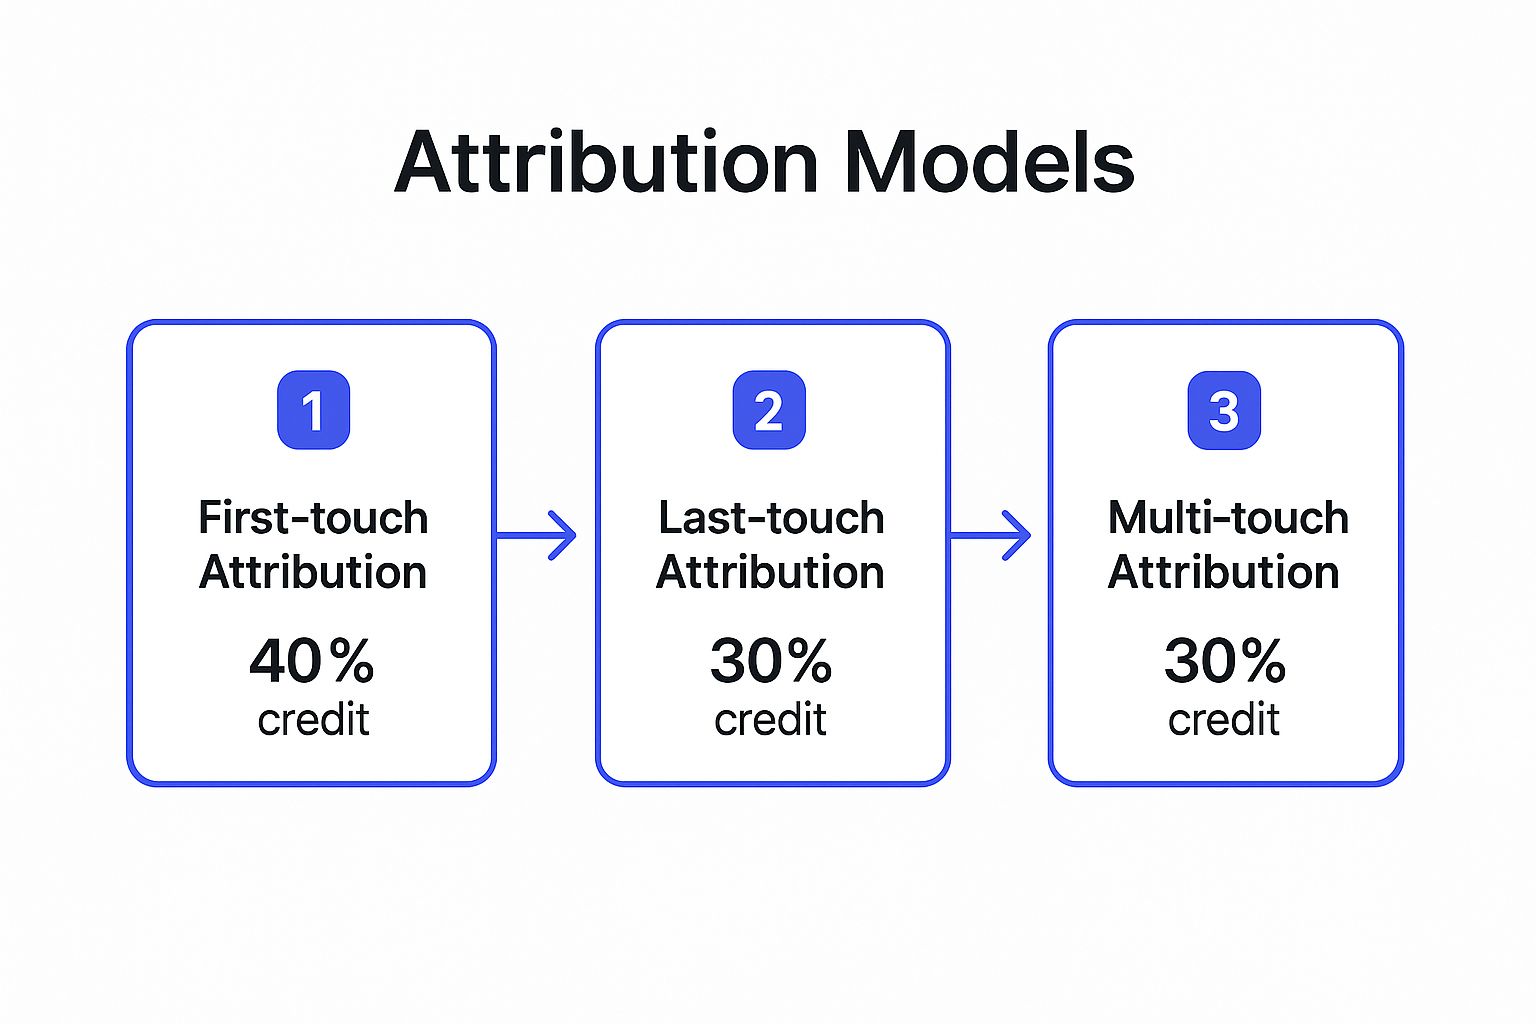 The visualization highlights how a multi-touch approach provides a more balanced view of the customer journey, preventing the over-valuation of just one interaction.
Strategic Analysis & Application
The right attribution model can completely change your perception of channel effectiveness, guiding smarter budget allocation. For example, Patagonia uses multi-touch attribution to balance its budget between performance marketing channels that drive immediate sales and brand marketing efforts that build long-term value. Similarly, the mattress company Casper used advanced attribution modeling to optimize its complex omnichannel strategy, understanding how podcast ads, social media, and search ads worked together to drive a single purchase. This prevented them from cutting budgets for top-of-funnel channels that were crucial for introducing new customers.
Key Insight: No single attribution model is perfect. The goal is not to find one "true" model but to use different models to understand the customer journey from multiple perspectives and make more informed, holistic decisions.
Actionable Tips for Implementation
To properly implement attribution modeling, you must move beyond default, last-click reporting.
- Start Simple, Then Evolve: Begin with basic models available in platforms like Google Analytics (e.g., first-touch, last-touch, linear). As your understanding grows, you can advance to more complex time-decay or data-driven models.
- Focus on Incrementality: Use your attribution insights as a hypothesis. Validate them with incrementality testing (e.g., geo-targeted lift studies) to prove whether a channel is truly driving additional conversions that wouldn't have happened otherwise.
- Combine with MMM: For a complete picture, combine your digital attribution data with top-down Marketing Mix Modeling (MMM). This helps account for offline channels, seasonality, and other external factors that digital attribution alone cannot capture.
8. Email Marketing Engagement Metrics
Email Marketing Engagement Metrics are a collection of key performance indicators (KPIs) that measure how your audience interacts with your email campaigns. This suite of metrics, including open rates, click-through rates (CTR), and unsubscribe rates, provides a comprehensive view of your email marketing effectiveness. Analyzing these metrics is fundamental to understanding audience resonance, list health, and the overall ROI of your email strategy, making them essential marketing performance metrics examples.
Strategic Analysis & Application
Effective email marketing isn't just about sending emails; it's about sending the right emails to the right people at the right time. BuzzFeed, for instance, masters this by using hyper-segmentation. They offer dozens of specialized newsletters, allowing subscribers to opt into niche topics like "This Week in Cats" or "Goodful," which consistently results in high open rates above 20%. Similarly, Charity: Water boosted its CTR by an incredible 127% by shifting from generic updates to powerful, personalized storytelling that visually connected donors to the impact of their contributions. These brands prove that high engagement is a direct result of relevance and value.
Key Insight: Look beyond vanity metrics like open rates. A high CTR combined with a low unsubscribe rate is a much stronger indicator of a healthy, engaged email list and effective content strategy.
Actionable Tips for Implementation
To turn email data into a strategic advantage, focus on continuous improvement and deep analysis.
- A/B Test Everything: Don't guess what works. Systematically test subject lines, sender names, send times, and content formats to identify what resonates most with your audience.
- Prioritize List Hygiene: Regularly monitor list health by tracking bounce rates and spam complaints. Clean your list of inactive or invalid emails to improve deliverability and protect your sender reputation.
- Implement Behavioral Triggers: Use marketing automation to send targeted emails based on user actions, such as welcome series for new subscribers, abandoned cart reminders, or follow-ups after a purchase. This personalization drives significantly higher engagement than generic email blasts.
Marketing Metrics Comparison Table
| Metric | Implementation Complexity 🔄 | Resource Requirements ⚡ | Expected Outcomes 📊 | Ideal Use Cases 💡 | Key Advantages ⭐ |
|---|---|---|---|---|---|
| Customer Acquisition Cost (CAC) | Moderate - requires consistent tracking and cost attribution | Medium - tracking marketing and sales expenses | Understand marketing efficiency and budget optimization | Budget allocation, growth scalability analysis | Clear ROI visibility, acquisition efficiency |
| Return on Advertising Spend (ROAS) | Low - simple revenue-to-ad spend calculation | Low - mainly ad spend and revenue tracking | Immediate feedback on ad campaign effectiveness | Real-time ad spend optimization, campaign evaluation | Easy to calculate, direct revenue linkage |
| Marketing Qualified Leads (MQL) | Moderate to High - requires behavioral scoring and team alignment | Medium to High - data collection and scoring | Identify qualified prospects for sales teams | Lead qualification, sales and marketing alignment | Improves sales focus, pipeline measurement |
| Customer Lifetime Value (CLV) | High - complex calculation needing historical & predictive data | High - data analysis across multiple touchpoints | Long-term revenue forecasting and investment justification | Strategic decision making, retention and acquisition balancing | Guides long-term strategy, identifies valuable customers |
| Conversion Rate | Low - simple ratio of conversions to visitors | Low - requires tracking conversions and visits | Measure effectiveness of marketing and user experience | Website optimization, A/B testing, campaign impact | Easy to understand, correlates directly with business results |
| Brand Awareness Metrics | High - requires surveys, monitoring, and analysis | High - time-consuming and potentially costly | Measure long-term brand recognition and market positioning | Brand building, competitive intelligence, loyalty strategy | Measures long-term marketing impact beyond conversions |
| Marketing Attribution Model Performance | High - complex models, data collection & analysis | High - requires analytics tools and expertise | Holistic channel effectiveness and budget allocation | Multi-channel attribution, marketing mix optimization | Holistic customer journey insights, improved ROI allocation |
| Email Marketing Engagement Metrics | Low to Moderate - tracking email opens, clicks, unsubscribes | Low - email platform analytics | Understand audience engagement and email campaign health | Email campaign optimization, list health monitoring | Immediate feedback, actionable for optimization |
From Metrics to Momentum: Turning Insights Into Action
Navigating the world of marketing performance metrics can feel like learning a new language. Throughout this article, we've dissected the essential vocabulary, moving beyond simple definitions to explore the strategic stories these numbers tell. From the direct profitability measured by Return on Advertising Spend (ROAS) to the long-term sustainability signaled by Customer Lifetime Value (CLV), each metric provides a unique lens through which to view your marketing engine's health.
The true power of these metrics, however, is not found in a static report. It's unleashed when you transition from passive measurement to active, strategic management. The marketing performance metrics examples we've covered, like tracking MQLs or optimizing conversion rates, are not just report cards; they are your roadmap to smarter, more impactful decisions. They reveal where your budget is working hardest, which channels deserve more investment, and what messages are truly connecting with your target audience.
The Shift from Data Points to Strategic Direction
To successfully make this shift, you must cultivate a data-informed culture. This means moving beyond the "what" and consistently asking "so what?" and "now what?".
- So What? (The Insight): A low Conversion Rate on a key landing page isn't just a number. It's a signal that there's a disconnect between the ad's promise and the page's experience. Is the call to action unclear? Is the form too long? This is the point of strategic analysis.
- Now What? (The Action): The insight should trigger a specific action. You might decide to A/B test a new headline, simplify the form fields, or add a customer testimonial to build trust. This is where data transforms into progress.
This cycle of Measure > Analyze > Act > Repeat is the heartbeat of a high-performing marketing team. It’s about creating a continuous feedback loop where insights from metrics like Email Marketing Engagement directly inform the subject line of your next campaign, and a deep understanding of your Marketing Attribution Model dictates how you allocate your budget next quarter.
Strategic Point: Your metrics dashboard should be treated less like an archive and more like a live playbook. It provides the real-time intelligence needed to call audibles, pivot your strategy, and capitalize on opportunities as they emerge.
Your Actionable Next Steps
Mastering your marketing analytics is an ongoing process, not a one-time project. Here’s how you can turn the concepts from this article into immediate momentum:
- Conduct a Metric Audit: Review your current dashboard. Are you tracking the metrics we’ve discussed? More importantly, are you tracking the ones most relevant to your specific business goals? Remove vanity metrics that don't drive decisions.
- Establish a Review Cadence: Schedule regular, non-negotiable meetings (weekly for tactical, monthly for strategic) to review performance. The goal isn't just to report numbers but to discuss insights and define clear action items.
- Bridge the Data Silos: Ensure insights are shared across teams. What the social media team learns about brand awareness can inform the content team's next blog post, and what the sales team learns about MQL quality can help the PPC team refine their ad targeting.
Ultimately, mastering marketing performance metrics empowers you to move with confidence. It replaces guesswork with evidence, allowing you to justify your budget, prove your value, and consistently steer your brand toward sustainable growth.
Ready to stop juggling spreadsheets and start making data-driven decisions with ease? PostSyncer provides a centralized analytics dashboard that simplifies tracking your most crucial social media metrics, connecting your campaign efforts directly to performance outcomes. Take control of your data and turn insights into action by exploring PostSyncer today.