


"Measuring" social media success isn't just about counting likes and followers anymore. That's old-school thinking. True success comes from tracking the metrics that actually line up with your real-world business goals.
It all starts with a simple question: what do you really want to achieve? Are you after brand awareness, lead generation, or better customer satisfaction? Once you know the answer, you can pick the right key performance indicators (KPIs)—like reach, engagement rate, or conversions—to see how you're actually doing.
Aligning Social Media with Business Outcomes
Before you even think about tracking a single metric, you have to define what success looks like for your business. So many teams get caught in the "vanity metrics" trap, chasing bigger follower counts or more likes without ever connecting them to business results. This creates a lot of noise and activity, but very little impact.
The absolute first step is to tie your social media efforts directly to tangible business objectives. Without that solid foundation, your metrics are just numbers without a story, and your strategy is a ship without a rudder.
From Vague Ideas to Concrete Goals
Let's get practical. A goal like "build brand awareness" sounds good, but it's too fuzzy to be useful. How do you measure "awareness"? You need to break it down into something concrete.
Instead of a vague aim, try something like this: "Increase our brand's reach on Instagram by 20% among our target demographic within the next quarter." See the difference? Now you have a clear target. You know the platform, the metric to watch (reach), and your deadline.
This same thinking applies to any business objective:
- Instead of "get more leads," aim to "Drive 50 qualified leads per month from our LinkedIn thought leadership content."
- Instead of "improve customer satisfaction," set a goal to "Reduce customer support response time on X (formerly Twitter) to under two hours and achieve a 90% positive sentiment score."
- Instead of "drive sales," target something specific like, "Generate $10,000 in revenue from our social commerce storefronts on Facebook and Instagram this quarter."
Key Takeaway: The line between a winning and a failing social media strategy is almost always goal clarity. When your goals are crystal clear, every post you create and every metric you analyze serves a distinct purpose.
The Power of the SMART Framework
There's a tried-and-true method for setting these kinds of powerful goals: the SMART framework. It’s a simple checklist to make sure your objectives are well-defined and, most importantly, trackable. It gives your team a clear roadmap to follow.
Every goal you set should be:
- Specific: What, exactly, do you want to accomplish?
- Measurable: How will you track progress and know when you've succeeded?
- Achievable: Is this goal realistic given your resources and current benchmarks?
- Relevant: Does this goal actually support your bigger business objectives?
- Time-bound: When does the clock run out? Set a clear deadline.
Using the SMART framework stops you from pouring time and money into activities that don't move the needle. It forces you to be strategic about what you want to achieve and how you’ll get there. This is what connects your day-to-day social media tasks to real, provable value.
To truly show the impact of your work, you have to go one step further and calculate social media ROI. This is how you transform your reports from simple activity logs into compelling business cases. By connecting your goals directly to financial outcomes, you can prove that your social media presence is a revenue driver, not just a cost center. It's the move that separates busy social media managers from strategic marketers who can prove their worth.
Choosing the Right Metrics for Your Goals
Alright, you’ve hammered out your strategic business goals. Now for the tricky part: picking the right data to watch. It's incredibly easy to drown in a sea of numbers, so think of this as building a custom dashboard for your specific strategy. You need to zero in on the Key Performance Indicators (KPIs) that directly signal whether you're getting closer to your objectives. This is how you move from just collecting data to generating real, actionable intelligence.
You wouldn’t use a thermometer to measure distance, right? The same logic applies here. Every goal demands its own set of metrics to track progress accurately. If you just chase likes and follower counts, you might be celebrating vanity metrics while your actual business goals—like leads and sales—go completely untouched.
This is where having a solid plan from the start becomes non-negotiable.
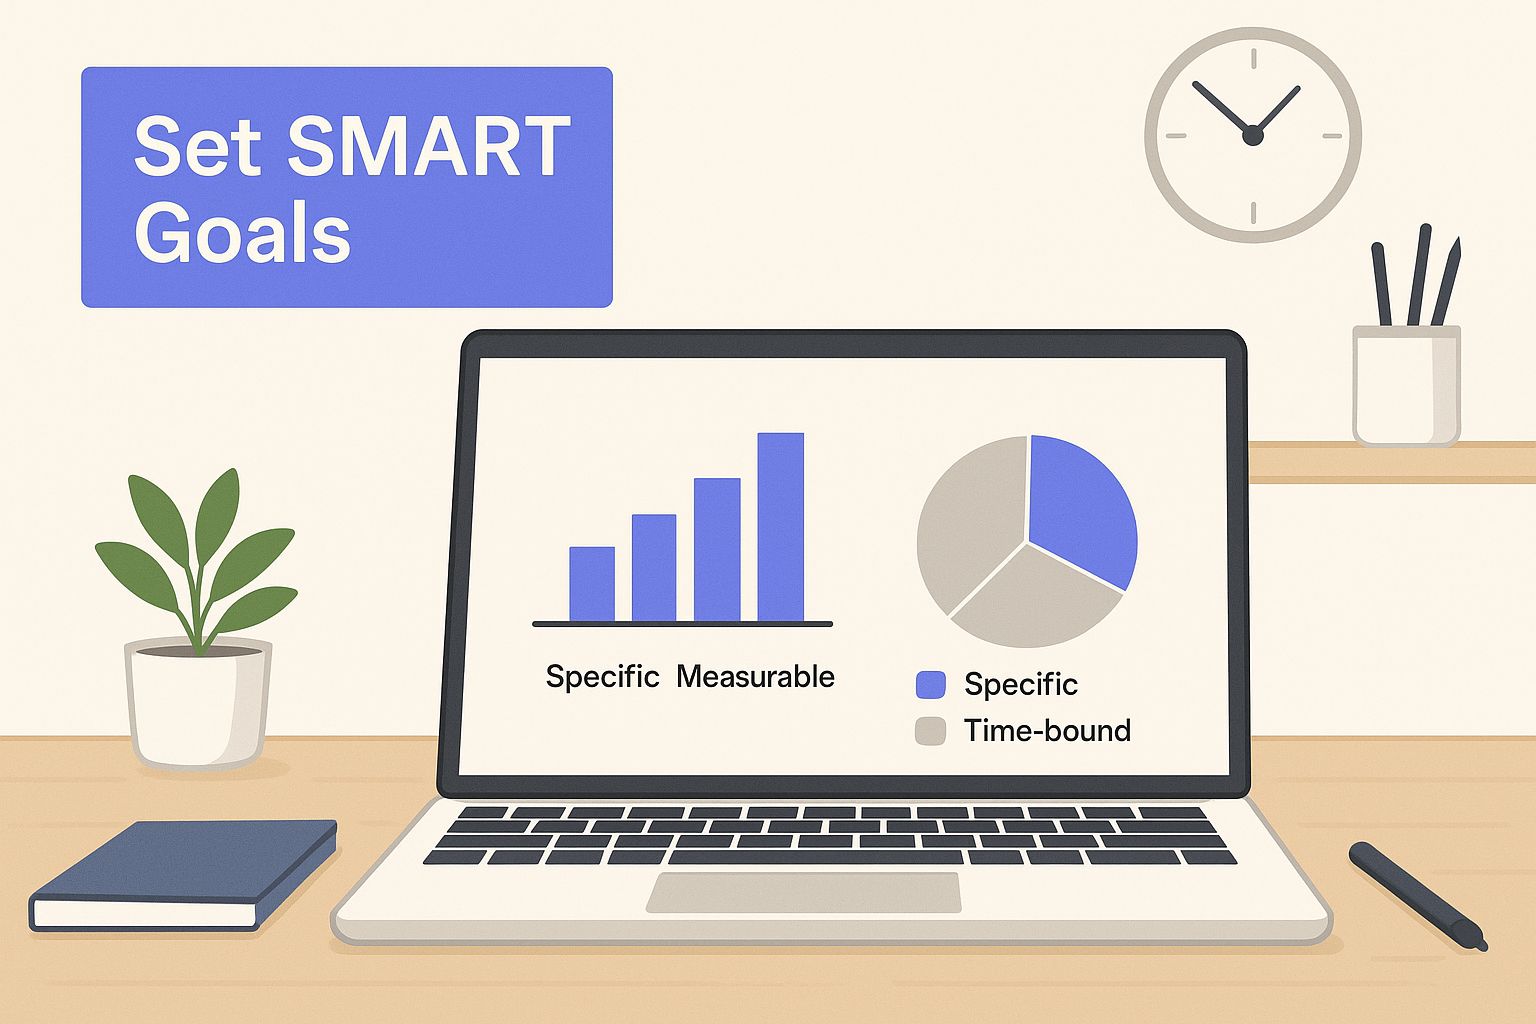
As the image shows, without a specific, measurable, achievable, relevant, and time-bound (SMART) plan, any data you gather will lack the context needed to be truly useful. It’s just noise.
Mapping Social Media Goals to Key Metrics
To make this practical, let's tie your high-level business goals directly to the numbers you should be tracking. The table below is a simple cheat sheet to help you connect the dots between what you want to achieve and what you need to measure.
| Business Goal | Primary KPIs (Metrics) | Example Platform |
|---|---|---|
| Increase Brand Awareness | Reach, Impressions, Audience Growth Rate | Instagram (Stories, Reels) |
| Drive Website Traffic | Click-Through Rate (CTR), Clicks | LinkedIn (Article Shares) |
| Generate Leads | Conversion Rate (Form Fills), Cost-Per-Lead (CPL) | Facebook (Lead Ads) |
| Boost Community Engagement | Engagement Rate, Comments, Shares | Facebook Groups |
| Improve Customer Loyalty | Brand Mentions, Customer Reviews, UGC | Twitter (X) |
This isn't an exhaustive list, but it's a fantastic starting point. It forces you to ask, "Why am I tracking this number?" and ensures every metric has a purpose tied back to a real business outcome.
Breaking Down the Core Metric Categories
Let's group the most common metrics into four essential buckets. This framework helps organize your thinking and ensures you're covering the entire customer journey, from a potential customer's first glimpse of your brand to them becoming a loyal fan.
1. Awareness Metrics
Think of these as the top of your marketing funnel. They tell you one simple thing: how many people are seeing your brand?
- Reach: The total number of unique people who saw your content. This is your true audience size, not just a raw activity number.
- Impressions: The total number of times your content was displayed. If your impressions are sky-high but your reach is low, it probably means the same few people are seeing your post over and over.
- Audience Growth Rate: This is a pulse check on how quickly you’re gaining new followers. Is your brand's visibility actually expanding over time?
A new local coffee shop, for instance, would live and die by these metrics at launch. Their main goal is to get the word out. High reach on Instagram and Facebook is a direct signal that they're succeeding.
2. Engagement Metrics
Okay, people are seeing your stuff. But do they care? Engagement metrics tell you if your content is actually resonating.
- Likes, Comments, Shares, and Saves: These are the classics for a reason. They show an active, interested audience. From my experience, a single thoughtful comment is often worth more than 100 passive likes.
- Post Engagement Rate: This is the magic number. It's the percentage of your audience that actually interacted with a post, calculated as
(Total Engagements / Total Impressions) x 100. It levels the playing field, telling you how compelling your content is, regardless of how many people saw it.
A B2B software company might focus almost entirely on engagement. Their goal isn't just to be seen but to spark conversations and establish themselves as thought leaders. For them, a high number of shares on a LinkedIn deep-dive article is a massive win.
3. Conversion Metrics
This is where the rubber meets the road—turning social media activity into tangible business results. Conversions track when a user takes that specific, desired action you've been hoping for.
- Click-Through Rate (CTR): The percentage of people who clicked a link in your post. This is absolutely vital for driving traffic to your website, blog, or a specific landing page.
- Conversion Rate: The holy grail. This is the percentage of visitors who came from social media and actually completed a goal, like filling out a lead form, subscribing to a newsletter, or making a purchase.
- Cost-Per-Click (CPC): For any paid campaigns, this shows exactly how much you're spending for each click. It's your go-to metric for judging the efficiency of your ad spend.
An e-commerce brand selling handmade jewelry depends on these conversion metrics. Their primary goal is sales, so tracking the CTR from an Instagram product post to their online store and the final conversion rate is non-negotiable.
4. Advocacy Metrics
Advocacy is the ultimate prize. It's when you've successfully turned happy customers into active, vocal promoters of your brand.
- Brand Mentions: How many times is your brand being talked about on social media, whether you're tagged or not? Monitoring tools are a huge help here for catching those untagged mentions.
- Customer Reviews and Testimonials: Positive reviews on platforms like Facebook or Google My Business are pure gold. They're powerful social proof that works 24/7.
- User-Generated Content (UGC): When customers start posting photos with your product, that’s organic marketing at its absolute finest. It’s authentic, trustworthy, and incredibly effective.
Once you’ve handpicked your essential metrics, the next job is to pull them all together in one place so you can see the full picture. If you want a head start, check out our guide on creating a comprehensive social media analytics report template to organize and present your findings like a pro.
Decoding What Your Engagement Metrics Really Mean
Let’s talk about engagement. It's the real pulse of your social media efforts. It’s the feedback loop that tells you, point-blank, if your content is actually hitting home with your audience.
Having a massive reach with nothing but crickets in the comments is a huge red flag. It’s a sign that your message, no matter how wide it’s spreading, isn't truly connecting. To figure out if your social media is really working, you have to dig deeper than surface-level numbers and understand the quality of the conversations you're sparking.
Think of it like this: a single, thoughtful comment or a share from a key person in your industry can be worth more than a hundred passive likes. These are high-value actions. They show your content wasn't just seen—it was understood and valued enough to be passed on. This is where you start to see genuine community and brand advocacy taking shape.
Moving Beyond Simple Likes
First things first, you need to separate passive engagement from active engagement. A "like" is a simple nod of approval. It’s nice, but it requires almost zero effort from the user.
A comment, a save, or a share, on the other hand, signals a much deeper level of interest. These actions tell the platform's algorithm that your content is valuable, which is a powerful signal that can boost your organic reach.
Your job is to read the story these metrics are telling. Getting lots of likes but zero comments? Your visuals are probably great, but your captions aren't sparking any conversation. Seeing a ton of saves on a post? That's fantastic—it means you're providing evergreen value that people want to come back to.
My Pro Tip: Don't just count the comments; read them. What's the sentiment? Are people excited, asking questions, or raising concerns? This qualitative data is pure gold and often more insightful than the raw numbers.
Calculating Your Engagement Rate
To get a real feel for your performance, you need to calculate your engagement rate. This metric puts your interactions into context by measuring them against your audience size or reach, giving you a consistent benchmark to track over time.
There are a couple of ways to do this:
- Post Engagement Rate: This tells you how engaging a specific post is. You calculate it by taking the total engagements on a post (likes, comments, shares, etc.), dividing by that post's total impressions, and then multiplying by 100.
- Account Engagement Rate: This gives you a bird's-eye view of your account's overall health. To get this number, divide the total engagements across all your posts over a certain period by your total follower count, then multiply by 100.
Of course, doing this manually is a drag. A tool like PostSyncer can automate these calculations, freeing you from spreadsheet hell so you can focus on what the numbers actually mean.
It’s also important to know how engagement is trending across the industry. For example, recent data showed that even with engagement rates dipping on platforms like Facebook (36%) and TikTok (34%) in 2025, the post engagement rate remains a critical indicator for marketers. It validates your reach—proving that a big impression count is actually leading to real audience interaction.
The Impact of Content Formats
Not all content is created equal, and different formats will naturally get different kinds of engagement.
A well-designed Instagram carousel, for instance, might get a lot more saves because it's packed with educational content people want to refer back to. A provocative TikTok, on the other hand, might rack up shares and comments as people jump in to debate the topic.
Take a look at how your audience interacts with:
- Static Images: Often great for quick likes and simple comments.
- Carousels: Tend to drive higher saves and share rates if the content is truly valuable.
- Videos (Reels, Shorts): Perfect for grabbing attention and can lead to high view counts and comments.
- Stories: The home of interactive elements like polls and Q&As that directly boost engagement.
Understanding these nuances is everything. For a more detailed breakdown, check out this complete guide to measuring social media engagement. Once you start decoding what each metric signifies, you can fine-tune your content strategy to build stronger, more meaningful connections with your audience.
Setting Performance Benchmarks That Matter

So, you’re finally seeing the data roll in. You’ve got an engagement rate of 3%, you picked up 500 new followers, and your latest campaign pulled in 10,000 impressions. That’s great, but here’s the real question: are those numbers any good?
Without context, data is just a bunch of noise. To get a real sense of your social media success, you need to establish performance benchmarks. These are what tell you what "good" actually looks like for your brand. This is the step that turns simple data collection into genuine strategic insight. Benchmarks are the yardstick you measure all your efforts against.
Looking Outward with Industry Benchmarks
One of the best ways to ground your performance in reality is to see how you stack up against everyone else. Industry benchmark reports are incredibly valuable for this, compiling average performance data across different sectors and platforms. They give you a clear picture of typical engagement rates, follower growth, and click-throughs for businesses just like yours.
For instance, you might find out that your 3% engagement rate on Instagram is actually crushing the 1.5% average for your industry. Suddenly, a simple number becomes a real competitive advantage. On the flip side, if your follower growth is trailing the industry average, that’s a clear sign you need to rethink your awareness strategy. These external benchmarks stop you from operating in a bubble and help you set ambitious but realistic goals.
Turning Inward with Historical Benchmarks
Just as crucial as looking outward is looking inward. Honestly, your own historical performance is a goldmine for setting internal benchmarks. By analyzing your results month-over-month and quarter-over-quarter, you can establish a baseline that is completely unique to your brand and your audience.
This is all about competing against your most important rival: yourself.
- Spot Your Greatest Hits: Look back at your best-performing content. What were the engagement rates? Which topics really clicked with your audience? This helps you understand what excellence looks like for your followers.
- Track Your Progress: Are your key metrics trending up or down? An internal benchmark helps you visualize your progress and immediately see the impact of new strategies.
- Know What Actually Works: When you compare a new campaign's results to your historical average, you can quickly tell if it was a hit. If your average cost-per-lead is $25 and a new campaign is getting you leads for $15, you’ve found a winning formula to replicate.
Setting internal benchmarks turns your analytics from a simple report card into a strategic playbook. It shows you what to double down on and what to ditch, ensuring you're always improving.
Understanding the Global Context
Beyond your industry and your own history, it helps to understand the massive social media world you’re playing in. Global usage trends give you that macro-level context, showing you the scale of the competition.
Think about the sheer scale for a moment. In 2025, there are an estimated 5.42 billion social media users worldwide. The average person is active on 6.83 different platforms every single month. This explosive growth means there’s a huge opportunity for reach, but also fierce competition for a slice of that attention. With users collectively spending over 14 billion hours a day on social platforms, metrics like how long they spend on your content become incredibly important.
To get a better handle on these macro trends, you can explore the latest global social media statistics and see the larger forces shaping user behavior.
This complete view—combining industry, internal, and global benchmarks—is what takes your process to the next level. You’re no longer just reporting numbers; you're interpreting them to build a smarter, more effective social media strategy. Many of the best social media reporting tools build these benchmarking capabilities right in, making it easier to track your performance against relevant comparisons and pull out insights you can actually use.
Using Modern Tools for Smarter Measurement
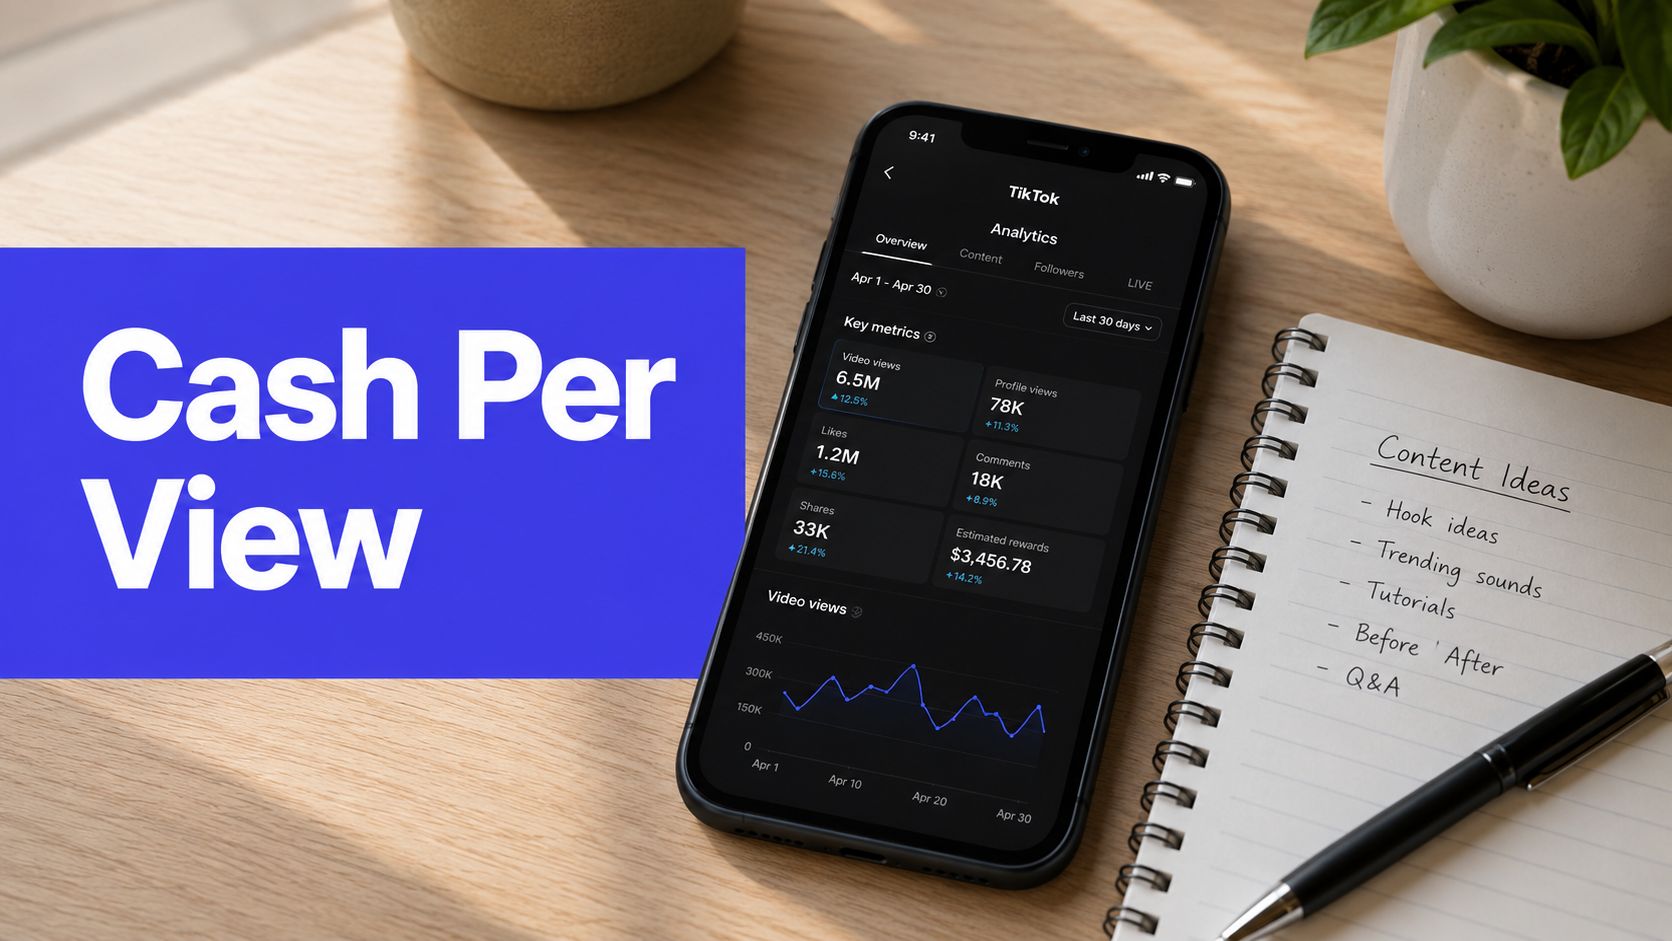
Let's be real: trying to pull data manually from every single social platform is a fast track to burnout. It's not just tedious—it's loaded with potential for human error. If you really want to get a handle on measuring your social media success, you need the right tools for the job. This isn't just about saving a few hours; it's about getting a crystal-clear picture of your performance and unlocking a serious competitive edge.
Your first stop should always be the native analytics tools that platforms provide for free. I'm talking about resources like Meta Business Suite and TikTok Analytics. They are surprisingly powerful and give you a direct pipeline to your performance data—everything from audience demographics to post-by-post engagement, straight from the source.
These built-in tools are perfect for quick check-ins and platform-specific insights. But as your brand grows and you're juggling multiple accounts, constantly bouncing between different dashboards just doesn't scale. That's where dedicated social media management platforms change the game.
Get the Big Picture by Aggregating Your Data
To truly understand your strategy's impact, you have to bring all your data under one roof. Platforms like PostSyncer, Sprout Social, or Hootsuite are built specifically for this. They pull performance metrics from all your connected accounts into a single, clean dashboard.
This isn't just a time-saver. When all your data lives in one place, you can:
- Compare performance across networks: Instantly see if your video content is crushing it on Instagram Reels or if it's getting more love on YouTube Shorts.
- Track campaigns holistically: Use campaign tags to see the combined results of a multi-channel promotion without patching together a dozen spreadsheets.
- Automate your reporting: Whip up comprehensive, presentation-ready reports in minutes, not hours.
This integrated approach is the key to efficient measurement. For example, a unified dashboard makes it incredibly easy to manage your content schedule right alongside your analytics. If you're looking to streamline your workflow, our guide on how to create a social media calendar offers practical steps that work hand-in-glove with these tools.
Here’s what a clean, all-in-one dashboard in a tool like PostSyncer can look like, putting your schedule and analytics side-by-side.
This centralized view immediately connects your planning to your results, closing the loop between what you post and how it performs.
How AI Is Changing the Measurement Game
The next leap forward in social media measurement is being driven by artificial intelligence. AI isn't some far-off concept anymore; it's a practical tool that gives marketing teams a massive advantage today.
AI has become a true game-changer. In 2025, an incredible 90% of businesses using generative AI for content report major time savings, and 73% see tangible increases in engagement. This isn't just about speed; it's about effectiveness. On top of that, social listening tools are becoming essential, with teams using them reporting up to twice the confidence in their social media ROI. This data-driven mindset, which you can read more about in recent social media statistics from talkwalker.com, is moving measurement from simple metrics to nuanced analysis.
So, how does AI actually help you measure better? It comes down to two main things:
Social Listening for Brand Sentiment: AI-powered social listening tools scan millions of public conversations online in real-time. They can find mentions of your brand (even when you aren't tagged), your competitors, and key industry trends. But here's the magic: they also analyze the sentiment behind those conversations, telling you if the buzz is positive, negative, or neutral. It’s like having a real-time focus group on your brand's reputation.
Generative AI for Better Content: AI can also help you create content that's more likely to succeed from the get-go. Tools like PostSyncer’s AI Content Studio can analyze your past performance to suggest topics, draft captions in your specific brand voice, and even pinpoint the best times to post for maximum reach. When you create better content, you get better data to measure.
Key Takeaway: Using modern tools isn't a luxury—it's a necessity for accurate and efficient measurement. Start with the free native analytics, then level up to an all-in-one platform like PostSyncer to unify your data. From there, embrace AI to find deeper insights and automate your workflows. This tech stack will save you countless hours and give you the clarity you need to make smarter strategic moves.
Got Questions? We’ve Got Answers.
Even with the best-laid plans, measuring social media can feel like you're trying to nail Jell-O to a wall. It's totally normal to hit a few tricky spots. Honestly, navigating these common hangups is how you sharpen your strategy and turn a spreadsheet full of numbers into confident, decisive action.
Let's dive into some of the questions I hear most often from marketers, and I’ll give you the straightforward answers you need to stay on track.
How Often Should I Actually Be Pulling Reports?
This is the classic "how long is a piece of string?" question. The right answer really depends on who’s looking at the report. You don't need a one-size-fits-all schedule; instead, create a rhythm that keeps everyone informed without creating a ton of extra work.
Here’s a breakdown that works for most teams:
- For your boots-on-the-ground team: A quick, weekly check-in is perfect. This keeps you agile, letting you double-down on what’s working and quickly pivot away from what isn’t.
- For leadership or clients: A monthly report is the sweet spot. It should focus on progress toward your big-picture KPIs. I always follow these up with a more strategic quarterly review to show how our social performance is directly fueling larger business goals.
The big takeaway here? Avoid the dreaded "analysis paralysis" from staring at dashboards all day. You're looking for trends over time, not reacting to every little daily blip.
What's the Real Difference Between Reach and Impressions?
This one trips up even seasoned pros, but getting it right is fundamental to understanding your performance. It's simpler than you think.
Reach is the number of unique people who laid eyes on your content. If 100 individual users saw your post, your reach is 100.
Impressions are the total number of times your content was displayed on a screen. If those same 100 people saw that post twice, you’d have 200 impressions.
Think of it like this: reach tells you how wide your net was cast, while impressions tell you how often it was seen. High impressions with low reach can be a great sign! It often means a smaller, more dedicated group of followers saw your content multiple times, which points to strong engagement within your core community.
How Can I Prove Social Media ROI if We Don't Sell Online?
This is the million-dollar question for B2B companies, local service businesses, or anyone who isn't driving direct e-commerce sales. When there's no "Buy Now" button to track, you have to get a little creative and connect the dots between social media activity and tangible business value.
Here's how you can make a powerful case for your social media ROI:
- Put a Price on Your Leads: Start by calculating the value of a single lead from social media. Look at your historical data. What's your average lead-to-customer conversion rate? What's the average lifetime value of a customer? If you know that 1 in 10 leads turns into a customer worth $5,000, then every single lead you generate from social is worth $500. Now you're talking business language.
- Show Me the Savings: Social media isn't just a revenue driver; it can be a cost-saver. For instance, if you've built an efficient customer service channel on social that reduces the number of calls to your support center, you can quantify that. Calculate the cost of an average support call (employee time, resources) and show how much you're saving.
- Track Brand Health & Market Position: Don't sleep on metrics like brand lift and share of voice. You can measure brand lift by running simple audience surveys before and after a major campaign. And an increase in your share of voice—how often your brand is mentioned online compared to your competitors—is a direct indicator of growing influence and market presence.
By framing your results in these terms, you can build a rock-solid business case for your social media efforts, no online checkout required.
Answering these questions is a great start, but to truly master your metrics, you need a central hub. To bring all this data together, automate your reporting, and get AI-powered insights, a tool like PostSyncer is essential. It simplifies everything from scheduling your content to analyzing its performance across every platform you use.