


Why Your Social Media Analytics Deserve Better Than Spreadsheet Chaos
We’ve all been there: drowning in endless spreadsheet tabs, manually copying and pasting metrics from five different social platforms. It’s a frustrating, time-consuming ritual that often leads to a report that’s more confusing than helpful. This manual chaos isn't just an annoyance; it's a genuine business risk.
I remember talking with a marketing agency that nearly lost a major client because of this exact problem. Their jumbled spreadsheet data failed to clearly show how their social media spending led to a 15% surge in qualified leads. The team was doing great work, but their reporting made it look like they were just spinning their wheels.
This story is all too common. Disorganized data reporting creates significant hidden costs, from wasted payroll hours to missed strategic opportunities. The core issue is that standard spreadsheets weren't built to handle the dynamic, multi-layered nature of social media data. They simply lack the structure needed to easily spot trends or tell a compelling story about your performance.
The True Cost of Disorganized Data
When you rely on disconnected spreadsheets, you're not just making your life harder—you're actively hindering your ability to make smart decisions. The consequences can be substantial:
- Missed Opportunities: Without a clear, consolidated view, you might overlook a viral post on one platform that should be informing your content strategy across all others.
- Inaccurate Insights: Manual data entry is a recipe for human error. A single misplaced decimal can lead to wrong conclusions about a campaign's effectiveness, causing you to invest in the wrong tactics.
- Wasted Time and Resources: Think about the hours marketers spend each month just gathering data instead of analyzing it. Using a proper social media analytics report template transforms that wasted time into strategic planning.
The industry is rapidly moving beyond these outdated methods. The global social media analytics market was valued at $10.23 billion in 2024 and is expected to grow to over $43 billion by 2030. This growth highlights a massive shift toward structured, intelligent data analysis. The tools are getting smarter, and a solid template is your first step to keeping pace. For a closer look at the platforms that can help, check out our guide on essential social media reporting tools.
Choosing Metrics That Actually Move Your Business Forward
It’s easy to get lost in a sea of numbers like follower counts and post likes. While they might give you a temporary ego boost, these vanity metrics often don't tell the full story or connect to your actual business goals. To build a social media analytics report that your stakeholders will genuinely care about, you need to start by picking metrics that reflect real-world business objectives.
The trick is to look past the surface-level stats and zero in on what truly drives action. If you’re running an e-commerce store, your focus should be on the click-through rate (CTR) on your product links and the conversion rate of visitors coming from social media. For a B2B company, you’d probably care more about lead generation form fills from LinkedIn or the number of demo requests that came from a specific campaign.
This infographic gives a great overview of the core analytics marketers frequently track.
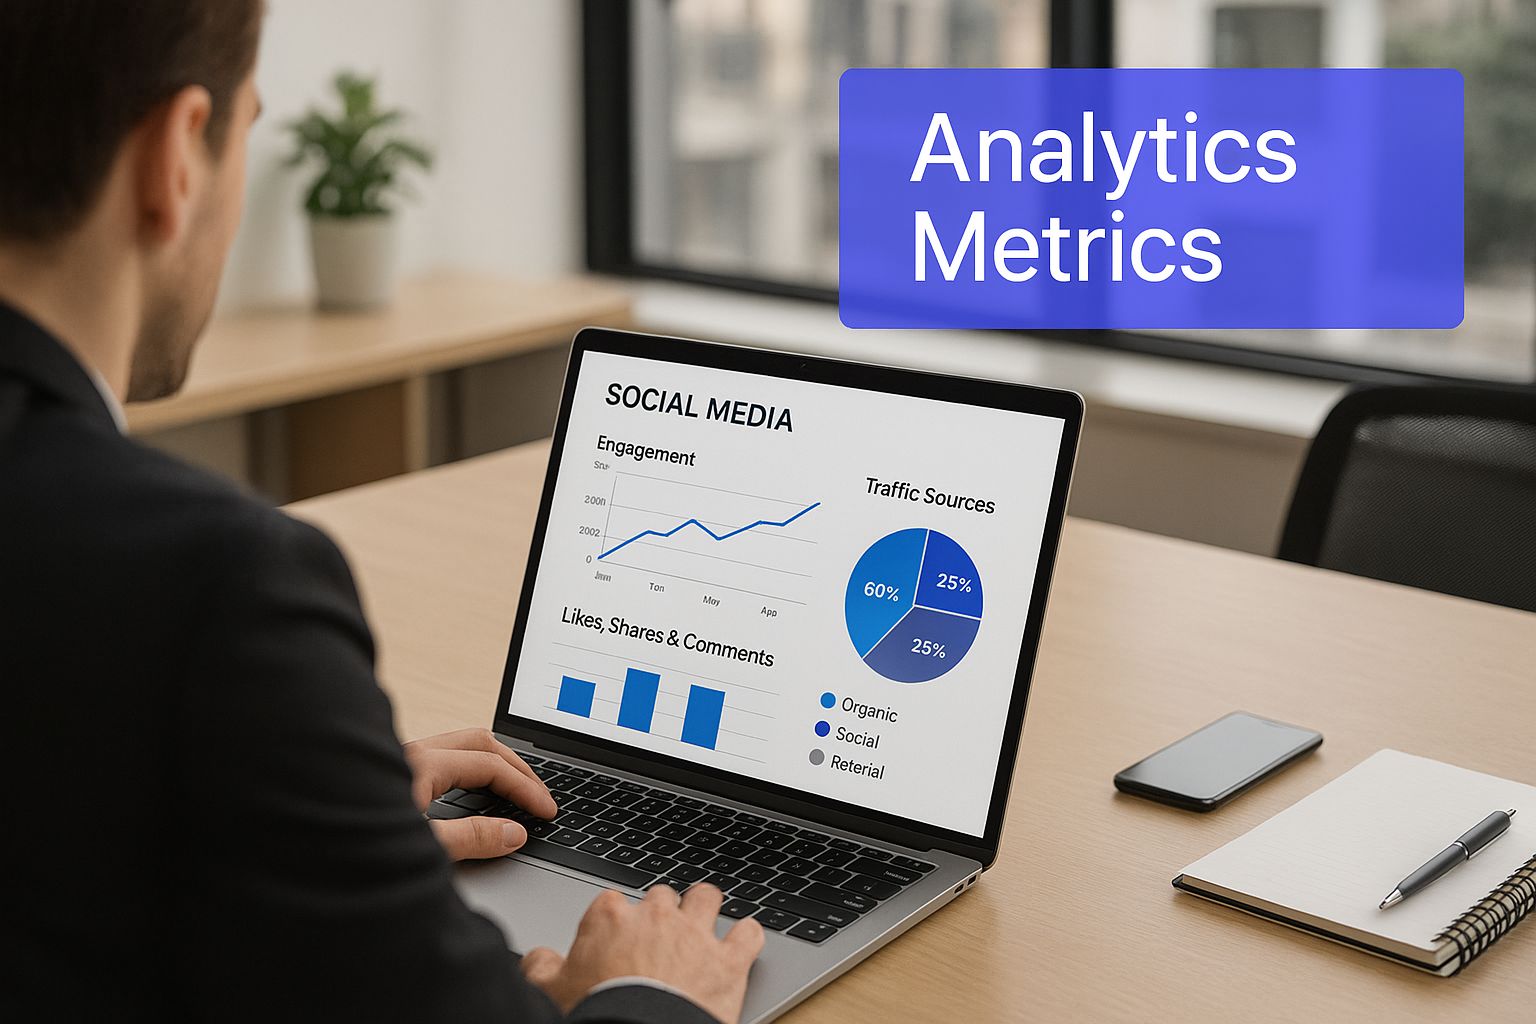
As the image shows, having a clear dashboard is crucial. It’s what helps you turn all that raw data into insights you can actually use to grow your business.
From Vanity to Value
To make this change, it helps to think about leading and lagging indicators. A lagging indicator, like quarterly sales from social media, tells you what’s already happened. It’s useful, but it’s history. A leading indicator, like the engagement rate on your educational content, can give you a peek into the future. A high engagement rate might suggest your audience is getting more interested and could be more likely to buy from you down the road.
To help you choose the right metrics, we've put together a table that ties specific metrics to common business goals.
Essential Social Media Metrics by Business Goal
A comprehensive comparison of key metrics organized by primary business objectives
| Business Goal | Primary Metrics | Secondary Metrics | Reporting Frequency |
|---|---|---|---|
| Brand Awareness | Reach and Impressions to gauge audience size. | Share of Voice (how you compare to competitors) and Audience Growth Rate. | Monthly & Quarterly |
| Engagement | Comments and Shares to measure active participation. | Likes/Reactions, Saves, and Applause Rate (total positive actions). | Weekly & Monthly |
| Conversions | Website Clicks and Attributed Sales from social channels. | Click-Through Rate (CTR), Cost Per Click (CPC), and Conversion Rate. | Weekly & Monthly |
| Customer Loyalty | Customer Testimonials and Mentions in user-generated content. | Repeat Customer Rate from social and Net Promoter Score (NPS) surveys. | Monthly & Quarterly |
This table shows how different goals require different yardsticks. Focusing on "Engagement" metrics is great for building a community, while "Conversion" metrics are all about proving direct financial impact.
Here's a practical way to think about it based on your goals:
- If you want to build brand awareness: Your main focus should be on Reach, Impressions, and Share of Voice. These numbers show how many people are seeing your brand and how visible you are compared to your competition.
- If you want to boost engagement: Keep a close eye on Comments, Shares, and Saves. These actions show a much deeper connection than a simple "like." For instance, a high number of saves on a how-to video tells you people find it genuinely useful.
- If you need to drive conversions: This is where you measure Website Clicks, Lead Form Submissions, and Attributed Sales. These are the "money" metrics that directly prove your return on investment and justify your social media spending.
When you intentionally select metrics that are tied to business outcomes, your social media report stops being just a list of numbers. It becomes a compelling story about your brand's growth and impact.
Building Your Analytics Infrastructure Without The Technical Nightmares
Before your social media analytics report template can really shine, you need a solid data foundation. This is all about getting clean, reliable information flowing from your social channels without the usual technical headaches. The great news is you don’t need to be a coding genius to build a system you can count on.
The first challenge is often just getting everything connected. If you’re juggling accounts on Instagram, Facebook, LinkedIn, and TikTok, the idea of linking them all to one analytics tool can feel pretty daunting. A common mistake is trying to manage each platform's native analytics separately. A centralized tool like PostSyncer makes this much simpler by letting you authorize all your accounts in a single spot. It's like switching from five different remotes to one universal one.
Ensuring Data Accuracy from the Start
With your accounts connected, your next focus is data accuracy. If your data is off, your insights will be flawed, and you'll end up making poor decisions. The solution is to establish a consistent process right from the beginning. This goes beyond just plugging things in; it’s about setting up proper tracking from day one.
A frequent issue marketers face is dealing with API (Application Programming Interface) limitations. Social media platforms can be particular about what data they share and how often. To navigate this, here are a few practical tips I’ve learned:
- Standardize Your Naming Conventions: Create a clear system for how you name your campaigns, ad sets, and individual posts across all platforms. This simple step prevents major confusion when you combine data from different sources.
- Use UTM Parameters Religiously: For every link you share, make it a habit to use consistent UTM parameters. This tells you exactly where your traffic is coming from, giving you detailed insight into which platform and which specific post is driving results.
- Choose a Reliable Aggregator Tool: Invest in a platform that manages the technical details for you. These tools are designed to handle API updates and pull data into one clean dashboard, saving you from constant troubleshooting.
Getting this infrastructure right is becoming more important than ever. The social media analytics market is projected to jump from $13.83 billion in 2024 to $17.39 billion in 2025. This massive growth is fueled by businesses needing better data to make smarter choices. You can dig deeper into this market growth on thebusinessresearchcompany.com. Building a stable data system now will set you up for success down the road.
Transforming Raw Data Into Organized Intelligence
Raw social media data is a bit like a pile of uncut diamonds—it has potential, but it’s not very useful until it's been refined. The first step is getting the data out of each platform. Every network, from Instagram to LinkedIn, has its own analytics dashboard and a unique way of exporting information. The real work isn't just downloading these files; it's about bringing them all together into a single, unified structure.
If you don't have a consistent system, you’ll spend more time wrestling with spreadsheets than actually analyzing what they say. This is exactly where a well-designed social media analytics report template becomes your most valuable tool. For instance, Instagram might track video views as "Views," while YouTube calls them "Plays." Your template needs to create a single, clear metric—like "Video Plays"—to house both data points. This small step is crucial for making accurate cross-platform comparisons.
Cleaning and Standardizing Your Data
Data cleaning is the part of the job that no one talks about, but it's what separates chaotic spreadsheets from clear insights. Social platforms are notorious for giving you incomplete or inconsistent data. A common headache I’ve dealt with is when key information, like a post's reach, doesn't show up for a few days. You need a reliable process to handle these gaps so your reports stay accurate.
Here are a few methods I've found incredibly helpful for keeping data organized:
- Create a Naming Convention: Before you even pull your first report, decide on a consistent naming system for your campaigns. Something like
Q3-BrandAwareness-IGStories-2024makes it simple to filter and sort your data later. - Standardize Your Metrics: Make a master list of all the metrics you track and write down exactly what each one means. This ensures that when you talk about "engagement rate," everyone on your team is on the same page.
- Automate When You Can: You don't need to break the bank on enterprise-level software. Look for smart ways to automate the grunt work. For example, a tool like PostSyncer can automatically pull data into a central dashboard, saving you from hours of manual exporting and cleaning every week.
By putting these simple organizational systems in place, you can sidestep the common issues that lead to data chaos. Instead, you'll build a solid foundation for analysis that can grow with your efforts.
Creating Visuals That Tell Compelling Stories
Numbers on a spreadsheet rarely inspire anyone to act. But the right visuals? They can transform that same data into a compelling story that even the busiest executive can't ignore. This isn't about making your report look pretty; it's about designing dashboards that make your key takeaways crystal clear and persuasive.

This is where your social media analytics report template really shines. It’s the point where abstract metrics on reach and engagement become tangible, persuasive business intelligence.
Choosing the Right Chart for the Job
Not all charts are created equal, and using the wrong one can actively mislead your audience. Imagine trying to show follower growth over time with a pie chart—it just wouldn't work. That same pie chart, however, is perfect for illustrating what percentage of your engagement comes from different platforms, like Instagram versus TikTok.
To help you visualize your data effectively, here’s a quick guide on matching chart types to social media metrics.
| Chart Type | Best For | Avoid When | Example Use Case |
|---|---|---|---|
| Line Graph | Tracking metrics over a continuous period. | Comparing static categories or showing parts of a whole. | "Tracking our follower growth month-over-month to see the impact of our new content strategy." |
| Bar Chart | Comparing distinct categories or groups. | Showing trends over a long period where a line graph is clearer. | "Comparing the average engagement rate of our video posts versus our image posts on Facebook." |
| Pie Chart | Showing the composition of a single whole (proportions). | Comparing more than 5-6 categories or showing change over time. | "Breaking down our audience demographics by age bracket to see who we're reaching." |
| Scatter Plot | Identifying relationships or correlations between two different metrics. | Presenting simple, single-metric data. | "Plotting post reach against engagement to see if higher reach truly leads to more interaction." |
As you can see, the right chart choice makes the insight obvious. A line graph clearly shows trends, while a bar chart excels at direct comparisons.
A thoughtful visual strategy ensures all your hard work gets the attention it deserves. Just like you map out your content in a social media calendar template, you should also plan how you'll present your results. This aligns your entire process, from content creation all the way through to reporting.
Uncovering Hidden Insights Through Advanced Data Interpretation
Having organized data is one thing, but knowing how to read between the lines is where you truly find your strategic edge. This is the moment you move from simply reporting numbers to interpreting what they mean for your business. A solid social media analytics report template gives you the foundation, but your analysis is what builds the skyscraper on top of it.
So, instead of just noting that your engagement dropped by 5%, you need to ask why. Was it a change in the type of content you posted? Or did a competitor launch a huge campaign that stole the spotlight? Real insight comes from connecting these dots.
From Correlation to Causation
A common trap many fall into is mistaking correlation for causation. For instance, you might see that your posts using a certain emoji get more likes. The easy conclusion is that the emoji is the key to success. But if you dig deeper, you might realize those posts were also published during peak engagement hours. This distinction is critical for making smart decisions rather than chasing false patterns.
Understanding how to read the data from various social media tools is essential. For example, knowing what your Linktree's analytics dashboard reveals about link clicks can give you a much clearer picture of what your audience actually finds interesting.
Asking Better Questions of Your Data
The quality of your insights is directly tied to the quality of your questions. It's time to use your data to challenge your assumptions and uncover new possibilities.
- Spot early warnings: Is that slow, gradual dip in post shares a sign that your audience is getting bored? Acting on this early can prevent a major performance drop later.
- Find hidden gems: Did a post on a "boring" topic surprisingly do really well? This could signal an untapped content area your audience is hungry for.
- Turn findings into action: Go beyond just saying "engagement was high." A better takeaway is, "Our Q&A video series drove a 20% increase in comments, so we should make it a monthly feature."
This analytical skill is precisely why the social media analytics market is projected to reach an incredible $107 billion by 2032. Businesses are betting big on people who can turn raw data into a clear direction. You can discover more about this market forecast on stellarmr.com. When you pair these human insights with the right social media automation tools, you can free up valuable time for more of this deep, strategic work.
Your Complete Social Media Analytics Success Blueprint
You’ve learned the ropes, now it’s time to put it all together. The final piece of the puzzle is turning your hard work into a sustainable reporting system. This is the moment your social media analytics report template goes from being a simple document to a core part of your business that delivers real value. It’s all about creating a rhythm that makes reporting a welcome habit, not a dreaded chore.
Setting Up a Sustainable Reporting Rhythm
Consistency is everything. From my experience, what works best for most teams is a monthly deep-dive report paired with quick weekly check-ins. The weekly meeting can be a fast, 15-minute huddle to look over top-level metrics. The monthly report is where you provide the detailed analysis needed for bigger strategic moves. This rhythm keeps you agile enough to catch trends early without getting lost in the numbers every single day.
One of the biggest hurdles I see is getting the team to actually use the new system. My advice? Start small. Don't throw every metric at them all at once. Kick things off with the top 3-5 most important KPIs for your business. Once everyone gets comfortable talking about those, you can slowly bring in more detailed analytics. This phased approach helps build confidence and avoids overwhelming your team.
Troubleshooting and Continuous Improvement
No system is foolproof, and you’re bound to run into issues. Maybe your tracking gets disrupted after a platform update, or a key metric suddenly takes a nosedive. When this happens, a good troubleshooting process starts with isolating the variable. Was it a change in your content? Your audience targeting? Or was it an external factor you didn't see coming?
For example, this dashboard from Google Analytics visualizes website traffic sources over time.
If your social traffic suddenly dropped like in this screenshot, your first move should be to check your UTM parameters and see if the social platform's API is having issues. It's better to check the technicals before panicking about your content strategy.
Your reporting system should never be set in stone. I recommend scheduling a quarterly review of the report itself. Ask your stakeholders a simple question: "Is this still telling you what you need to know?" Their answers are gold. This feedback is critical for making sure your analytics efforts stay aligned with changing business goals. As you grow, this feedback loop will help you turn a simple reporting process into a true competitive advantage.
Ready to build a reporting system that drives real results? PostSyncer’s all-in-one platform gives you the tools to track, analyze, and report on your social media performance with clarity and confidence. Start your free 7-day trial of PostSyncer today!