


If you want to track social media engagement effectively, you have to look past the surface. Forget about just racking up likes or followers. It’s about methodically watching, measuring, and figuring out how people actually interact with your content so you can learn what truly clicks with them.
Beyond Likes: Why Tracking Engagement Is Critical
Let's get one thing straight: vanity metrics don't pay the bills. Real social media success isn’t about the follower count—it's about understanding what your audience genuinely finds valuable. That's why having a smart way to track engagement is no longer a nice-to-have; it's a core part of business intelligence.
When you track engagement consistently, you create a direct feedback loop. You see exactly what content sparks a conversation and what gets completely ignored. This isn't just data for a report; it informs everything from your content calendar to how you handle customer service, helping you make smarter moves that lead to real results.
Uncover What Your Audience Really Wants
When you start tracking engagement properly, you stop guessing and start responding to actual user behavior. Do your followers go crazy for quick video clips, or do they prefer to dig into a detailed carousel? Are they asking questions in the comments or quietly saving your posts for later?
Answering these questions is how you give your audience more of what they love, which is the secret to building a loyal and genuinely interactive community.
Key Takeaway: Tracking engagement is really just about listening at scale. Every single comment, share, and save is a little piece of data telling you something important about what your audience needs and what piques their interest.
This is more important than ever, given how people use social media today. The average person hangs out on almost seven different social networks every month. With that kind of scattered attention, a shallow, single-platform view just won't cut it.
And when you consider that social ad spend is projected to soar to $276.7 billion by 2030, you realize how critical it is to understand engagement across all those platforms. It’s the only way to turn those likes and shares into something tangible for your business. You can explore more about these trends and what they mean for your brand's bottom line.
Ultimately, tracking engagement transforms your social media from a simple broadcast channel into a powerful engine for growth, community, and customer insight.
Choosing Engagement Metrics That Actually Matter
To get a real grip on your social media engagement, you first have to decide what’s actually worth measuring. It’s easy to get fixated on vanity metrics like your total follower count, but that’s a rookie mistake. Real progress comes from tracking metrics that tie directly back to your bigger business goals.
A simple way I like to think about this is by splitting metrics into two buckets: Interaction Metrics and Awareness Metrics. This separation instantly clarifies what the numbers are telling you about your performance.
Interaction metrics are all about how your audience actively responds to your content—they’re the best sign of a healthy, connected community. On the flip side, awareness metrics show you how far your content is traveling and give you a sense of your brand's overall visibility.
Getting a Feel for Interaction Metrics
Interaction metrics are the gold standard because they represent genuine participation. They prove your content was compelling enough to make someone stop the endless scroll and actually do something.
Here are the big three:
- Comments: This is a direct conversation starter. When someone leaves a comment, it means your post triggered a thought or question, opening the door for a real connection.
- Shares: A share is basically a personal endorsement. Someone liked your content so much they were willing to vouch for it to their own network. This is organic reach at its finest and a massive vote of confidence.
- Saves: This one is a game-changer, especially on platforms like Instagram. A save tells you that a user found your content so valuable they want to come back to it later. It's a clear signal of high-quality, evergreen appeal.
A "Like" is a polite nod, but a "Save" is someone bookmarking your brand for future reference. Prioritizing saves over likes helps you focus on creating content with lasting value rather than momentary appeal.
Gauging Visibility with Awareness Metrics
While interactions are where the magic happens, you can't ignore how many eyeballs are on your content in the first place. This is where awareness metrics come into play, giving you the bigger picture.
- Reach: This is the total number of unique people who saw your post. Think of it as the size of your audience for that specific piece of content.
- Impressions: This is the total number of times your content was shown to users. This number can be higher than your reach because the same person might see your post multiple times. A high impression-to-reach ratio can mean your content is resonating well and being shown repeatedly.
To make sense of engagement, it's helpful to see how different metrics fit together. This table breaks down the core metrics, what they measure, and why they should matter to your strategy.
Core Social Media Engagement Metrics and What They Mean
| Metric Category | Specific Metric | What It Measures | Strategic Importance |
|---|---|---|---|
| Interaction | Comments | The number of comments on a post. | Indicates content is thought-provoking and sparks conversation. Great for community building. |
| Interaction | Shares | The number of times a post is shared. | Shows strong content endorsement and expands reach organically. |
| Interaction | Saves | The number of times a post is saved. | Signals high-value, useful content that users want to revisit. |
| Interaction | Likes | The number of likes on a post. | A basic measure of content appreciation; a low-effort interaction. |
| Awareness | Reach | The number of unique users who saw your content. | Measures the breadth of your audience and brand visibility. |
| Awareness | Impressions | The total number of times your content was displayed. | Gauges content frequency and visibility in feeds. |
Understanding these distinctions helps you build a more intentional and effective social media plan that goes far beyond just chasing likes.
With around 5.24 billion active social media users across the globe, cutting through the noise is a serious challenge. People use these platforms for wildly different reasons— 50.8% are there to keep up with friends, while others are looking for news or just killing time. This directly impacts what they engage with. If you want to dive deeper, you can explore more about the global state of digital and see how these trends can shape your strategy.
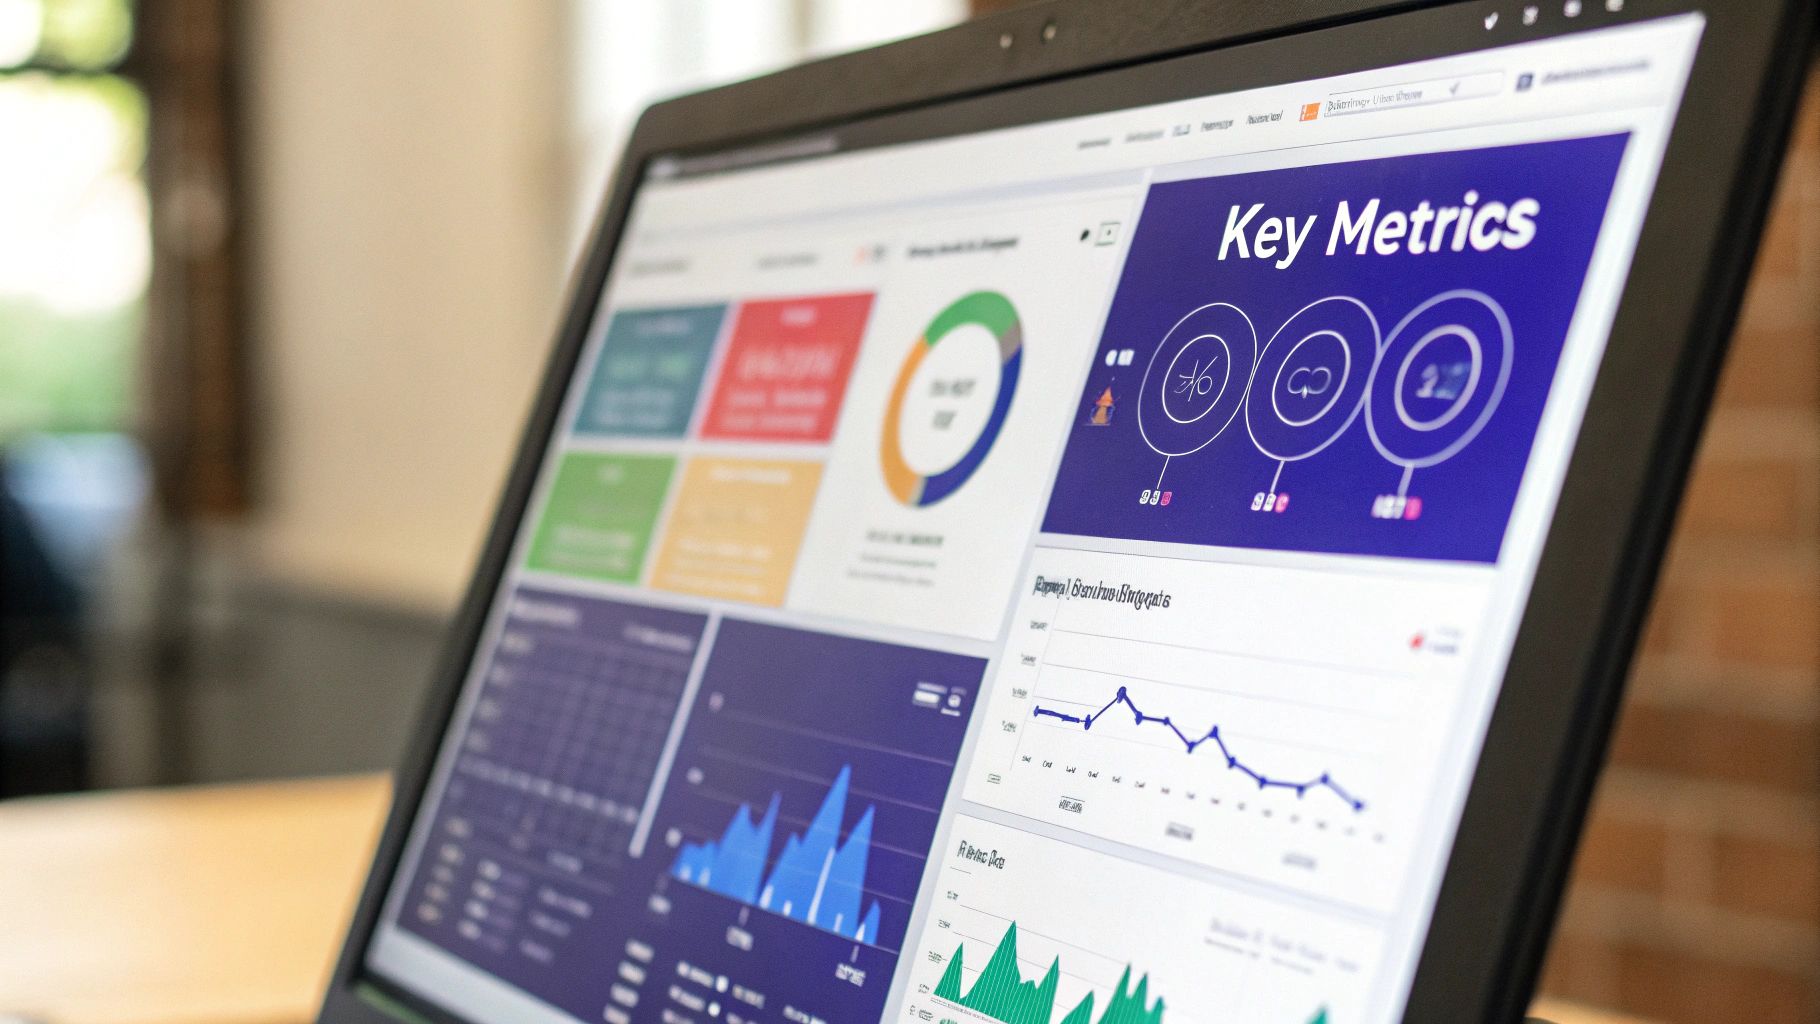
Building Your Social Media Tracking Dashboard
Alright, you've picked your key metrics. Now comes the fun part: building a system that actually brings those numbers to life. To really get a grip on social media engagement, you need a centralized command center. Without one, you're stuck in the chaotic loop of hopping between Facebook's, Instagram's, and LinkedIn's native analytics every single week. Trust me, that gets old fast.
A unified dashboard doesn't just save you a ton of hours; it gives you a single, clean view of how you're doing across every channel. While tools like PostSyncer are designed to pull all this data together for you automatically, you can even rig up a basic version yourself using native analytics as your starting point. The real goal here is to get from raw, messy data to actionable insights as efficiently as possible.
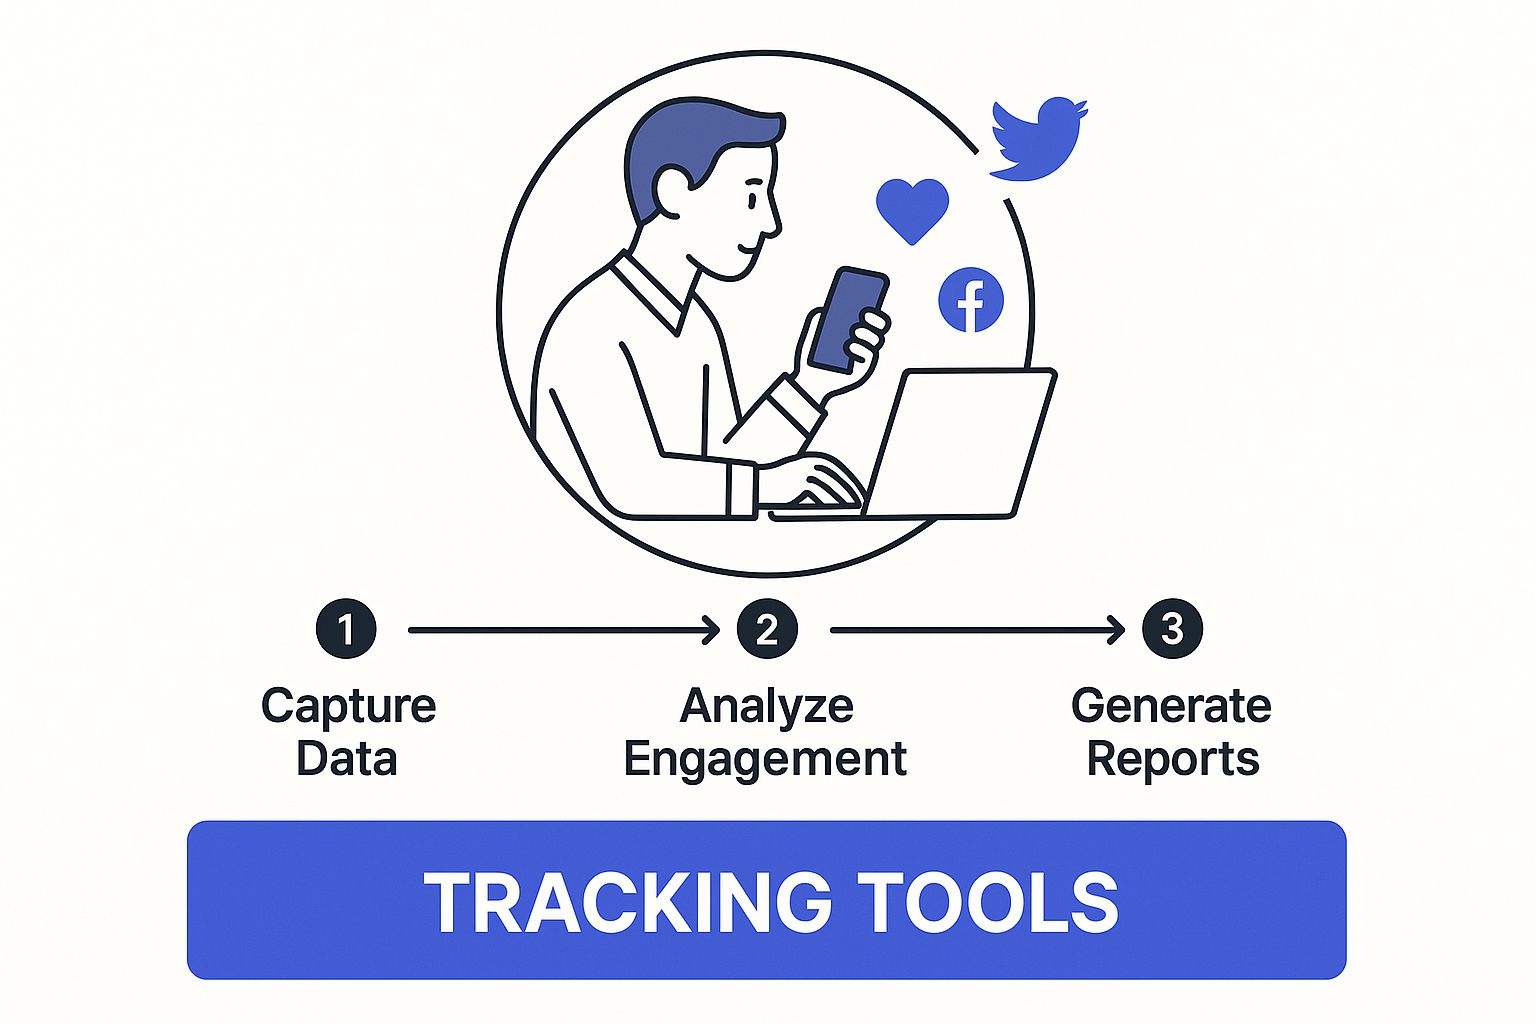
This kind of workflow shows why having a dedicated tool is so important. It streamlines the whole process of monitoring your performance, no matter where your audience is scrolling.
Customizing Your Dashboard View
Once you've connected your accounts to a tool (or a spreadsheet, if you're going the manual route), it's time to customize. Don't just dump every single metric onto one screen—that’s a recipe for analysis paralysis. Instead, think about creating custom views based on the questions you need to answer. For instance, you could have a "Campaign Performance" view that only pulls in metrics tied to a specific promotion or hashtag.
This is where content tags or labels become your best friend. Tagging every post by its format (like Video, Carousel, or Infographic) or by its theme (like Product Launch, UGC, or How-To) lets you filter your dashboard in seconds. Suddenly, you can see exactly which content types are getting all the love.
This kind of visual reporting, like you'd see in PostSyncer, makes it incredibly easy to spot trends—like which posts earned the highest engagement rates—without having to manually crunch the numbers in a spreadsheet.
Another great move is to set up automated weekly reports. These email summaries make sure you never miss key insights and keep stakeholders in the loop without giving them full dashboard access. And if you're managing social media for clients, you might want to look into dedicated CRM solutions for marketing agencies to see how you can tie engagement data directly into broader client management.
By building a smart, customized dashboard, you turn tracking from a mind-numbing chore into your biggest strategic advantage.
How to Find Actionable Insights in Your Data
Collecting data is the easy part. Honestly, anyone can do it. The real skill—the thing that separates the pros from the amateurs—is finding the story behind the numbers.
To really get a handle on your social media engagement, you have to move beyond just watching metrics go up and down. Your goal is to spot meaningful patterns that give you a clear, confident direction for your content strategy.
So, you need to start asking the right questions. Instead of just noting that your reach went up, dig in and ask why. Was it a specific post? A certain time of day you posted? That new video format you tried? This kind of curiosity is what turns raw data into powerful, strategic knowledge.
Uncovering Meaningful Trends
One of the most effective ways I've found to pull real insights from a pile of numbers is comparative analysis. It sounds fancy, but all it really means is putting your data sets side-by-side to see what jumps out. Don't just look at this week's numbers in a vacuum. Compare them directly against last week's performance or your monthly baseline.
For example, you might notice that your video posts consistently bring in more comments and shares than your static images. That isn't just a fun fact; it's a direct signal from your audience telling you exactly what they want to see more of.
Pro Tip: Always look for the outliers in your data. A sudden, massive spike in saves on one particular carousel post is a huge clue. Your job is to play detective, figure out what made that post so valuable, and then see how you can replicate that magic in future content.
The scale of social media is staggering, with users spending over 14 billion hours daily across different platforms. It's a massive sea of activity, and the brands that use sophisticated tools to analyze it are the ones who report the highest confidence in their results. To get a better sense of this opportunity, you can discover more insights about social media statistics and the trends shaping the industry.
From Data Points to Action Plans
Once you spot a trend, the next step is to form a hypothesis. Think of it as an educated guess. If your video posts are getting more clicks, your hypothesis might be: "Our audience prefers short, educational video content over other formats."
Now, you have something to test. You can build a small campaign around that idea to see if you're right.
- Analyze: Spot a pattern in your analytics (e.g., carousels get way more shares).
- Hypothesize: Form a theory about why (e.g., my audience loves seeing multi-part visual stories they can swipe through).
- Test: Create more content based on that specific hypothesis and measure the results. Does the pattern hold up?
This simple, iterative cycle of analyzing and testing is the absolute core of a data-driven strategy. When you consistently apply this framework, you transform your social media analytics from a simple report card into a roadmap for real growth.
For a more detailed breakdown of what to track, check out our complete guide on how to measure social media success.
Using Engagement Data to Refine Your Content Strategy

This is where the magic happens. Turning raw numbers into a smarter content plan is the whole reason you put in the effort to track social media engagement in the first place. The data you've gathered is a direct line to what your audience actually wants to see, and now it's time to turn those insights into action.
I've always found that a simple framework keeps me on track: Analyze, Hypothesize, Test, and Repeat. It’s a powerful cycle that stops you from just throwing content at the wall to see what sticks. Instead, you start building a strategy based on real evidence from your community, creating a data-driven content engine that gets smarter over time.
The Analyze and Hypothesize Phase
First things first, dive into your performance dashboard. What jumps out at you? Maybe you notice that your carousel posts consistently get 3x more shares than your single-image posts. That’s your analysis—a clean, simple observation.
Now, you form a hypothesis, which is just a fancy way of saying you make an educated guess. Based on your data, your hypothesis might be: "My audience is hungry for multi-part visual stories and in-depth tips that are best delivered in a carousel format." This isn't just a random idea; it's a clear theory you can actually test.
Pro Tip: Don't just celebrate your wins. Look at what’s bombing, too. If a certain type of post consistently falls flat, your hypothesis could be that the topic or format is a bad fit for your followers. That's an equally valuable piece of information.
Testing and Refining Your Content
With your hypothesis in hand, it's time to put it to the test. If you think carousels are the way to go, dedicate a chunk of your next content batch to creating more of them. You can even run small A/B tests to get more granular with your findings.
- Test different headlines on similar carousel concepts to see which one drives more saves.
- Experiment with the visuals. Do infographics outperform photo-based carousels?
- Vary your calls-to-action at the end. Does asking a question get more comments than telling them to share?
As you experiment, don't forget how effective video marketing can also give your engagement a serious boost. Every test will give you fresh data, which kicks off the "Analyze, Hypothesize, Test, Repeat" cycle all over again. This process of continuous refinement is a fundamental part of a strong content creation workflow.
If you want more ideas on keeping all these moving parts organized, check out our guide on how to plan social media content.
Got Questions About Tracking Social Media Engagement?
Even with a perfect plan in hand, you're bound to run into a few questions once you start digging into your social media metrics. It happens to everyone. Let's walk through some of the most common ones I hear, so you can clear up any confusion and get back to growing your brand.
How Often Should I Actually Check My Metrics?
This is probably the number one question people ask, and the honest answer is: it depends on why you're looking.
For your day-to-day community management—replying to comments, answering DMs—a quick daily check-in is a must. You need to be responsive. But for spotting real trends, a dedicated weekly review is where the magic happens. It helps you see patterns without getting bogged down by a single post's random spike or dip.
When it comes to the big picture, a full monthly or quarterly analysis is non-negotiable. This is when you step back, look at what’s really working (or not), and make meaningful changes to your overall strategy.
Key Takeaway: Don’t mix up daily check-ins with deep analysis. Daily is for reacting and engaging. Weekly and monthly reviews are for strategizing and planning. Each has a critical role to play.
What's the Real Difference Between Reach and Impressions?
Ah, the classic mix-up. It’s simpler than it sounds.
Reach is the total number of unique people who saw your content. Think of it as individual human beings. If 100 different people see your post, your reach is 100.
Impressions, on the other hand, are the total number of times your content was shown on a screen. If those same 100 people each saw your post twice, you would have 200 impressions. Reach tells you how big your audience is, while impressions show you how much visibility your content is getting.
Are "Vanity Metrics" Like Likes Totally Useless?
Not completely, but you have to put them in their place. A "like" is a low-effort nod of approval. It’s nice to get, but it doesn't tell you much.
True engagement is measured by actions that require more effort—things like shares, saves, and thoughtful comments. These are the metrics that show someone found your content so valuable they had to do something with it.
Think of likes as a quick, surface-level pulse check. They can tell you if your content is generally resonating, but your actual strategy should be built around those deeper, more meaningful metrics. If you're looking for more guidance on what matters most, exploring different social media reporting tools can really clarify which numbers you should be laser-focused on for your specific goals.
Ready to stop juggling platforms and start seeing clear results? PostSyncer centralizes all your analytics into one powerful, easy-to-use dashboard. Start your free 7-day trial today!