Let's be honest, trying to manage your social media without a proper analytics dashboard is like trying to fly a 747 without an instrument panel. You might have a general idea of where you're headed, but you're completely blind to your speed, altitude, fuel levels, or that mountain dead ahead. You're just guessing.
A social media analytics dashboard is that instrument panel. It’s your command center, pulling all the chaotic data from Instagram, Facebook, TikTok, and wherever else you post into one single, clear view. It translates all those confusing numbers into signals you can actually use to steer your strategy.
So, What Is a Social Media Analytics Dashboard, Really?
Instead of logging into five different platforms every morning to piece together what’s happening, a dashboard brings it all home. It stops you from flying blind, relying on gut feelings and flimsy vanity metrics like like counts.
A great dashboard moves you beyond just collecting data; it helps you connect the dots. You can finally see how that spike in Instagram Story views might be linked to the ad campaign you just launched on Facebook—all without juggling a dozen browser tabs.
This unified view isn't just a time-saver. It’s about seeing the bigger picture of your performance and making smarter decisions because of it.
From Raw Numbers to Crystal-Clear Insights
At its heart, a social media analytics dashboard is a translator. It takes all the raw, scattered data points from your accounts and turns them into charts, graphs, and reports that you can understand in a split second.
- It gathers everything: It pulls metrics from all your connected profiles—Facebook, Instagram, TikTok, LinkedIn, you name it—into one central hub.
- It makes data visual: It transforms endless rows of numbers into intuitive visuals. This way, you can spot trends, wins, and problems at a single glance.
- It gives you context: It helps you figure out why something happened, not just what happened, by letting you compare performance over time or between different networks.
This isn't just a "nice-to-have" anymore. As businesses lean more heavily on data, these tools have become mission-critical. The market for social media analytics is exploding, valued at USD 10.23 billion in 2024 and projected to soar to USD 43.25 billion by 2030. You can dig into the full market analysis on Grand View Research to see just how massive this shift is.
For any serious brand, creator, or agency, a dashboard is no longer a luxury; it’s an essential piece of equipment for getting real results.
Key Metrics Your Dashboard Must Track
A great social media analytics dashboard does more than just throw numbers at you; it tells the story of your brand's performance. The metrics are the words in that story, and understanding them is how you turn raw data into smart decisions. Think of them as the vital signs for your online health, each one answering a critical question about your business.
To make sense of it all, we can group these metrics into four main categories. This approach keeps you from drowning in data, allowing you to focus on what actually drives growth.
The infographic below gives a fantastic high-level look at some of the most fundamental metrics every marketer should be watching.
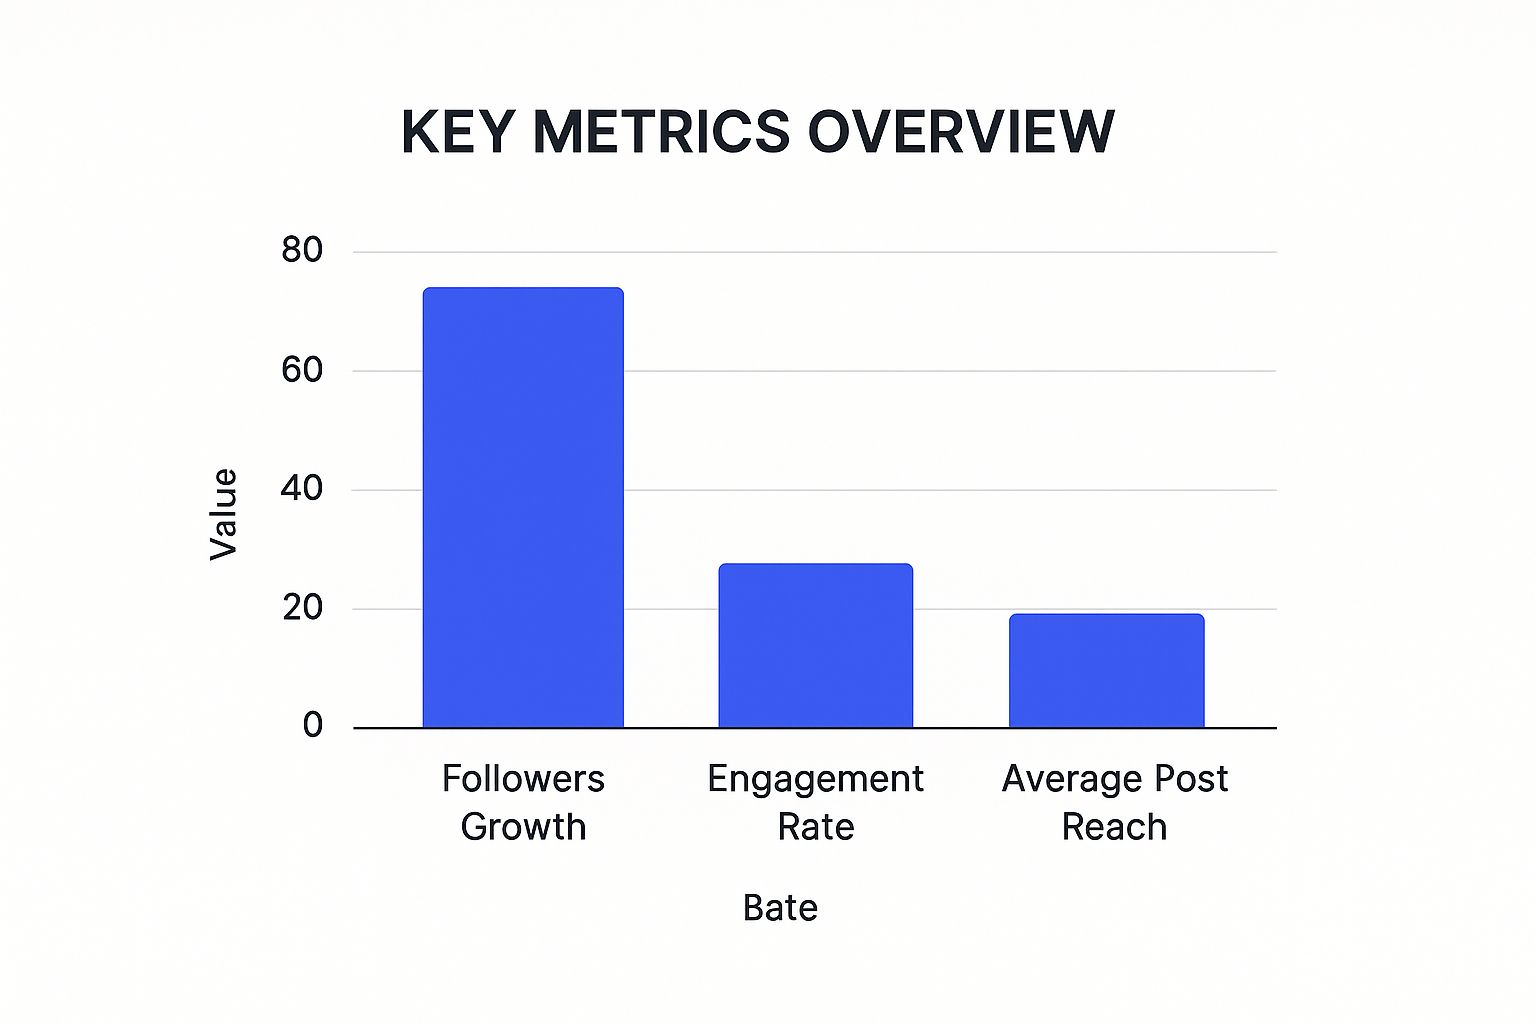
As you can see, different metrics paint different parts of the picture. They show how audience growth, engagement, and content reach all work together to create a healthy, effective social media strategy.
To really dig in, let's break down the essential metrics you need to monitor. The table below outlines the most crucial ones, what they measure, and the strategic questions they help you answer.
Essential Social Media Analytics Metrics
| Metric Category | Specific Metric | What It Measures | Strategic Question It Answers |
|---|---|---|---|
| Engagement | Likes, Comments, Saves, Shares | How your audience interacts with your content. | "Is our content genuinely connecting with people and sparking conversation?" |
| Awareness | Reach & Impressions | The number of unique people who see your content (Reach) vs. the total times it was displayed (Impressions). | "Are we expanding our brand's visibility and getting in front of new eyes?" |
| Audience | Follower Growth Rate | The speed at which you are gaining (or losing) followers over a specific period. | "What content or campaigns are effectively attracting new people to our brand?" |
| Conversion | Click-Through Rate (CTR) | The percentage of people who see your post and click a specific link. | "How effective is our social media content at driving traffic to our website or landing pages?" |
By tracking these key performance indicators (KPIs), you get a 360-degree view of your strategy's effectiveness, from building a community to directly impacting your bottom line.
Core Metric Categories to Monitor
Here's a closer look at what these categories tell you.
Engagement Metrics: The Pulse of Your Community
These metrics show how actively your audience is interacting with your content. They're a direct signal of how well your message is landing.
- Likes, Comments, and Saves: These are more than just vanity numbers. They show your content is valuable enough for someone to act on. Saves, in particular, are a huge tell—they mean your content has a longer shelf life and someone found it useful enough to return to.
- Shares and Retweets: This is where true advocacy kicks in. A share is a personal endorsement. It says, "I trust this brand enough to show it to my own network." That's far more powerful than a simple like.
High engagement proves you're building a real community, not just collecting a list of followers.
Reach and Impression Metrics: Gauging Your Visibility
Reach is the number of unique people who see your content. Impressions are the total number of times your content is displayed, even if it's to the same person multiple times.
Knowing the difference is huge. For example, high impressions but low reach might mean your content is being shown over and over to the same small group. The real goal is to expand your unique reach and get your message in front of fresh eyes.
Audience Growth Metrics: Tracking Your Influence
This goes way beyond your follower count. It’s about the quality and direction of your audience growth. A good social media analytics dashboard will track your follower growth rate over time, helping you pinpoint which campaigns or posts are drawing new people in.
This data gets even more powerful when you layer in audience demographics. Knowing the age, location, and interests of your new followers helps you sharpen your content strategy to give them more of what they love.
Conversion Metrics: Proving Your Business Impact
Finally, these are the metrics that connect your social media efforts to real business results. These are the numbers that justify your social media ROI to your boss or client.
- Click-Through Rate (CTR): Measures the percentage of people who clicked a link in your post.
- Cost-Per-Click (CPC): Shows how much you’re paying for each click in an ad campaign.
- Leads Generated: Tracks how many potential customers you’ve captured through forms or sign-ups on social media.
Tracking these metrics isn't just a good idea; it's essential for competing in a market that's exploding in value. The social media industry was valued at USD 252.95 billion in 2024 and is on track to hit USD 466.56 billion by 2029, all thanks to a constantly growing user base.
For a deeper dive into the specific platforms that help you track these vital signs, check out our guide on the best social media analytics tools available today.
Choosing a Dashboard with Features That Matter
Let's be honest, not all analytics tools are built the same. A lot of them promise you the world but end up delivering little more than a slightly fancier spreadsheet. If you want to get past surface-level data, you need a social media analytics dashboard with features that give you a real strategic edge. It’s all about cutting through the marketing fluff to find the functions that will actually help you grow.
Think of it like choosing a car. A basic model gets you from A to B, sure. But a premium model comes with built-in GPS to guide you, blind-spot monitoring to keep you safe, and a performance engine to help you accelerate. In the same way, a top-tier dashboard gives you the tools to navigate the social media landscape, avoid costly mistakes, and speed right past your competition.
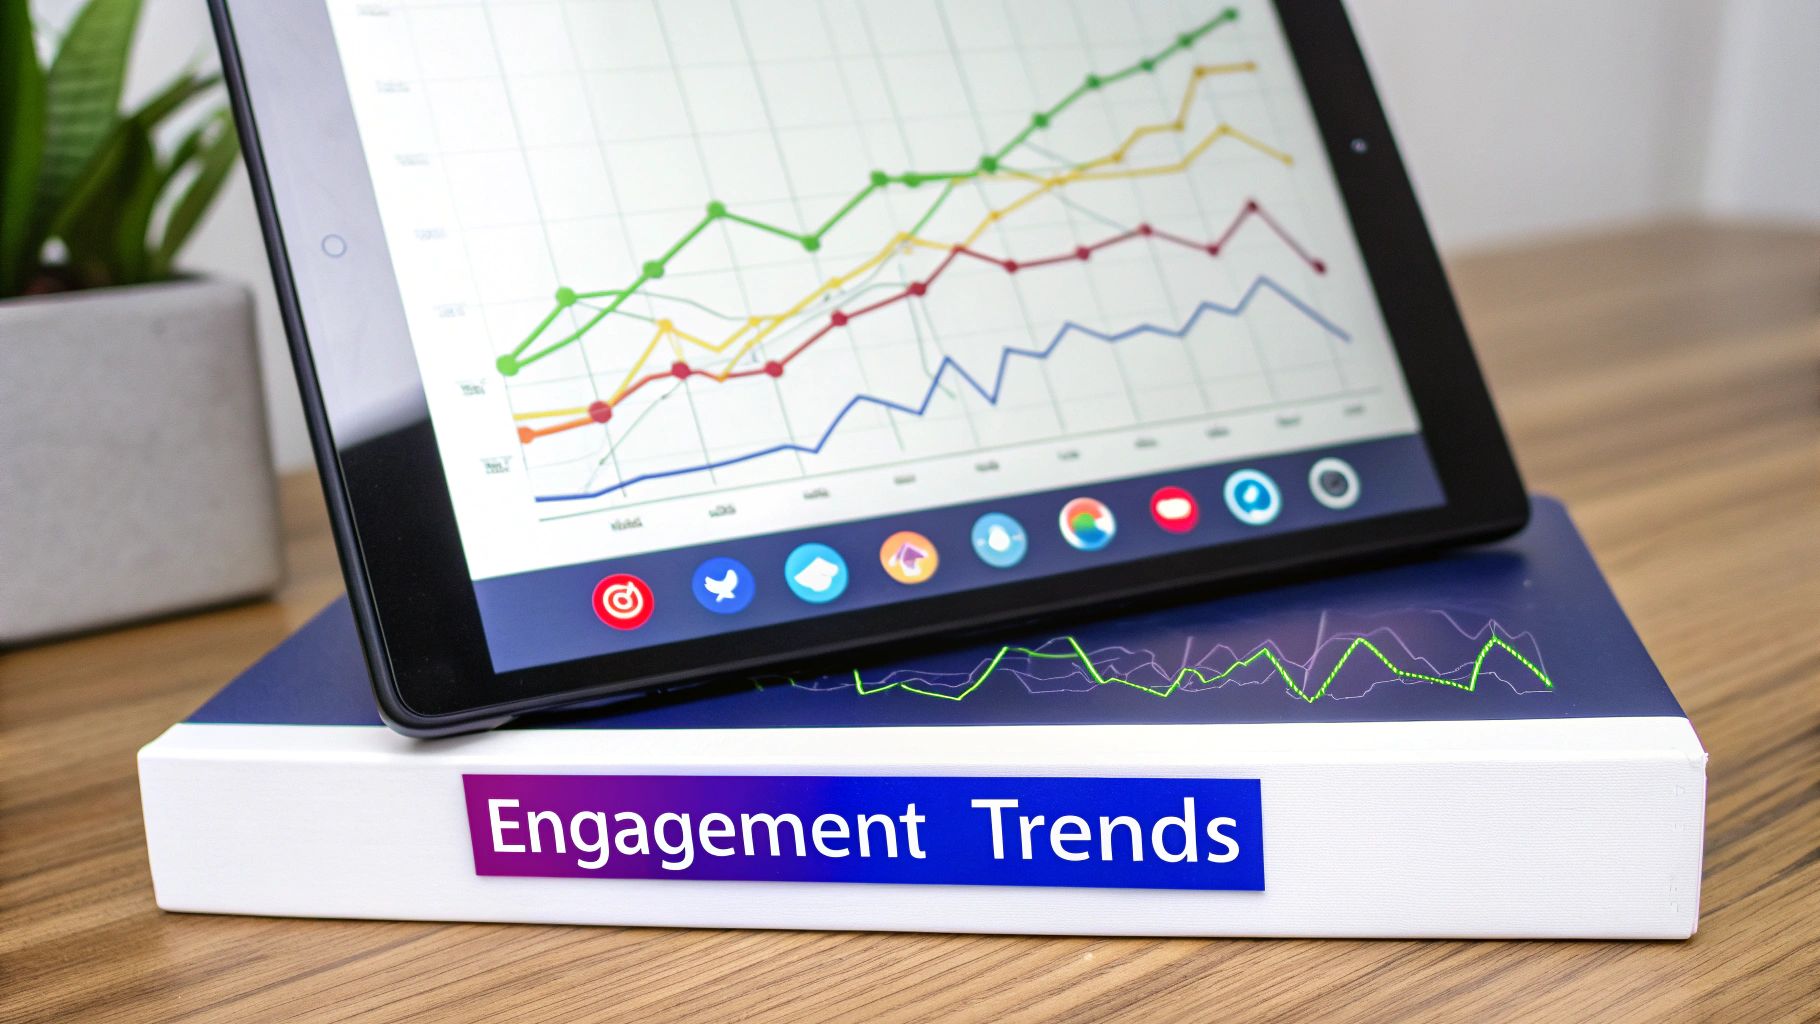
This kind of immediate, at-a-glance view is a lifesaver. It tells you exactly where your strategy is hitting the mark and where it needs a tune-up, saving you hours of digging through data manually.
Core Features for a Smarter Strategy
When you're shopping around for a dashboard, your priority should be finding one that does more than just track basic numbers. You're looking for features that serve up deeper, more actionable intelligence. There are a few non-negotiables you should have on your list—capabilities that turn raw data into smart decisions.
And these advanced features aren't just for huge corporations anymore. The biggest names in every industry are using AI and machine learning for everything from analyzing user behavior to understanding how customers feel about them. It gives them a massive advantage. Today, the best platforms make that same power accessible to everyone. If you want to get a sense of just how central this tech has become, you can learn more about the evolving social analytics market on Fortune Business Insights.
A powerful dashboard doesn't just show you what happened; it helps you understand why it happened and what to do next. It’s the difference between looking in the rearview mirror and having a real-time GPS guiding your every move.
Must-Have Dashboard Functionalities
To make sure the tool you pick can actually deliver those kinds of insights, you need to confirm it has these essential features baked in:
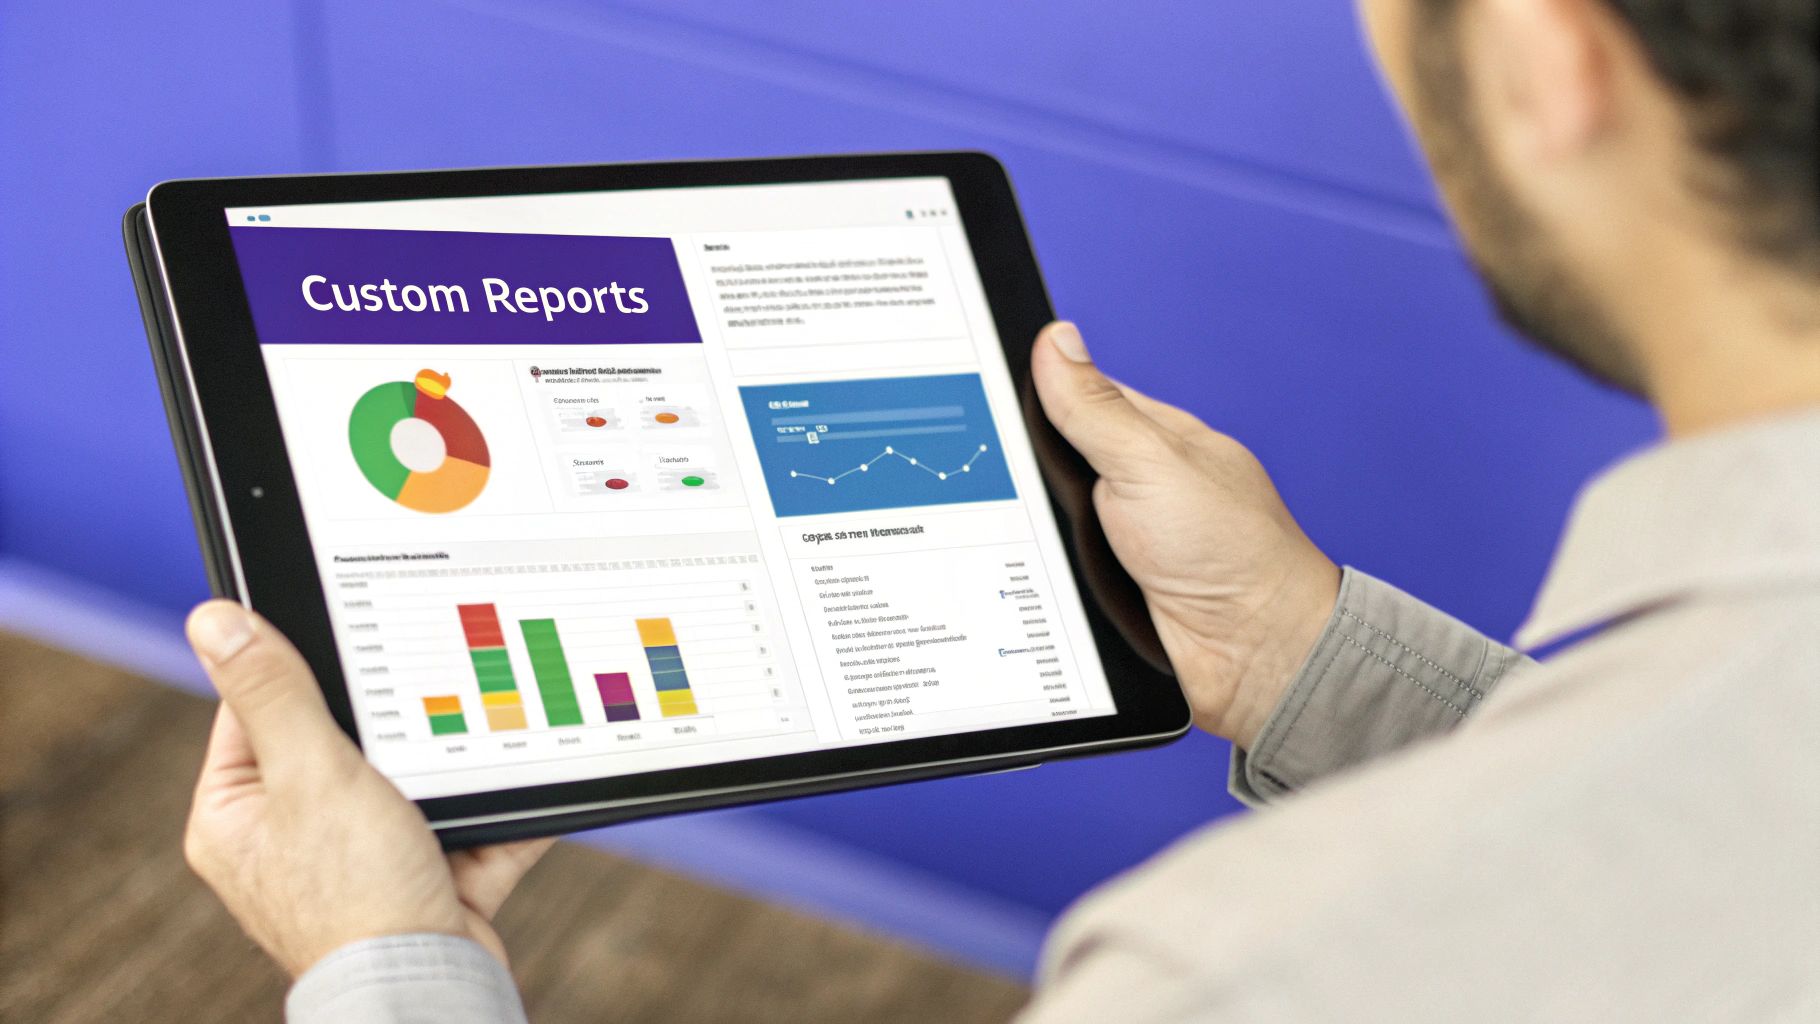
- Customizable Reporting: Every business has its own unique KPIs. A one-size-fits-all report just won't cut it. You need the ability to build custom reports that focus on the metrics that matter to your goals, whether that's driving e-commerce sales, generating leads, or boosting brand awareness.
- Real-Time Data: Social media moves at lightning speed. A trend can blow up and be over in a matter of hours. Real-time analytics let you jump on opportunities and handle crises as they unfold—not days later when it's already too late.
- Competitive Analysis: Knowing how you're doing is only half the battle. You have to benchmark your performance against your main rivals. This feature lets you see what's working for them, spot gaps in their strategy you can exploit, and find new ways to outperform them.
- Sentiment Analysis: Numbers alone don't tell the whole story. A post might have tons of engagement, but is that engagement positive praise or a firestorm of angry comments? Sentiment analysis uses AI to read the emotion behind the mentions and comments, giving you a true pulse on how people feel about your brand.
Platforms like PostSyncer are designed to integrate all of these features seamlessly. This creates a powerful feedback loop where you use competitive insights to shape your content, optimize it with real-time data, and then prove its value with custom reports. That integrated approach is what separates a simple tool from a genuine strategic asset for your business.
How Different Teams Use Analytics Dashboards
A social media analytics dashboard isn't a one-size-fits-all tool; its value completely changes depending on who's looking at the screen. The very same data can tell a wildly different story to a marketing agency, a solo content creator, or a massive enterprise. Each one has unique pressures, different goals, and specific questions that need answers.
Think of it like a professional chef's knife. A sushi chef uses it for delicate, precise cuts. A butcher uses it for heavy-duty work. A line cook uses it for rapid-fire chopping. Same tool, but the application and the desired result couldn't be more different.
The real magic of a high-quality dashboard like PostSyncer is its ability to adapt. It delivers specific, role-based intelligence that actually drives success, customizing the view so every professional sees exactly what they need to make their next strategic move.
For Marketing Agencies Proving ROI
For a marketing agency, the dashboard is the ultimate tool for accountability and efficiency. Agencies are constantly juggling multiple clients, each with their own brand voice, goals, and performance expectations. Their biggest challenges? Proving their work is worth the money and managing this complex portfolio without drowning in manual reporting.
A social media analytics dashboard cuts right through these problems by:
- Centralizing Client Data: Instead of logging into a dozen different social accounts, agencies can monitor every client's performance from a single command center. This saves a staggering amount of time and cuts down on the risk of human error.
- Automating Reports: Let's be honest, manually building client reports is a soul-crushing time sink. A good dashboard can generate custom, professional-looking reports in minutes, freeing up the team to focus on what they're paid for: strategy and creative work.
- Demonstrating Clear ROI: Agencies can draw a straight line from their social media activities to real business goals like website traffic, lead generation, and sales. Showing a client a graph that connects a specific campaign to a 30% increase in leads is how you keep them happy and signed on.
For an agency, a dashboard isn't just for looking at numbers; it's a client management and retention machine. It provides the hard evidence needed to prove their worth, month after month.
For Content Creators Building a Brand
Content creators live and die by their connection with their audience. Their main goal is to figure out what resonates so they can create more of it, grow their following, and land those lucrative brand partnerships. Their dashboard is a direct line into their audience's mind.
It helps them pinpoint which content formats are popping off, what topics are sparking the most conversation, and even the exact time of day their followers are glued to their phones. This information is pure gold. It allows creators to make decisions backed by data instead of just throwing content at the wall and hoping something goes viral.
A powerful dashboard also becomes a crucial part of their media kit, giving brands concrete proof of their reach and influence.
For Enterprises Managing Brand Health
When you get to the enterprise level, a social media analytics dashboard operates on a global scale. These massive brands are less concerned with the likes on a single post and more focused on the big picture: overall brand health, their position against competitors, and managing risk across different markets.
Their dashboards are set up to monitor the heavy hitters:
- Brand Sentiment: They're constantly tracking the overall feeling (positive, negative, or neutral) in conversations about the brand. This is how they spot a potential PR crisis before it explodes.
- Share of Voice: This is all about measuring how their brand's presence stacks up against key competitors. Are they leading the conversation in their industry, or falling behind?
- Campaign Performance: They need to analyze the impact of major marketing initiatives across different regions and platforms to see what's truly working on a macro level.
For these teams, the dashboard provides the high-level intelligence needed to steer a massive ship, ensuring the brand stays consistent and its reputation is protected on a global stage. The ability to coordinate these efforts is everything, which is why pairing analytics with a solid plan for social media scheduling is absolutely essential for executing a cohesive global strategy.
Turning Social Media Data Into Action
Let's be honest, insights are completely useless if they just sit inside your dashboard. The real magic of a social media analytics dashboard isn't just showing you what happened—it’s helping you figure out what to do next. It’s time to stop just watching your data and start putting it to work.
Think of your analytics dashboard as a treasure map. Every metric—a sudden spike in engagement, a dip in reach, a surge in story views—is a clue. Your job is to piece them all together to see the bigger picture, turning passive observation into deliberate, game-changing decisions.
From Data Points to Strategic Plays
So, how do you actually turn a number on a screen into a smart strategic move? It comes down to a simple but incredibly powerful workflow: spot a trend, form a hypothesis, and then test it out. This is how your dashboard goes from being a simple report card to your personal playbook for winning on social.
This whole approach is about creating a tight feedback loop between what your audience does and what you post. For a deeper look at how this can fuel business growth, check out this guide on B2B Marketing Analytics for Growth.
The goal is to create a cycle where every post informs the next. You're no longer just guessing what works; you're building a strategy based on concrete evidence from your own audience.
Here are a few practical ways you can start doing this right away:
- A/B Test Content Formats: Your dashboard shows that your single-image posts get solid reach, but video posts get 3x the shares. That’s your signal. For the next two weeks, run an A/B test pitting video posts against carousels that cover similar topics. Your analytics will quickly tell you which format drives the engagement you really care about.
- Refine Ad Targeting: You notice that 70% of your new followers are women aged 25-34 living in major cities. This is a goldmine. Use this demographic data to sharpen your ad targeting, putting your budget behind the exact audience that's already connecting with your brand organically.
- Optimize Your Posting Schedule: PostSyncer shows a consistent engagement spike on Sunday mornings between 9 AM and 11 AM. That’s not a fluke; it's a clear signal from your audience. You can immediately tweak your content calendar to drop your most important posts right in that peak window, guaranteeing more eyes on your content.
Identifying Your Winning Content Pillars
Your dashboard is also your best friend when it comes to finding your top-performing content pillars. Look for the recurring themes, topics, or formats that consistently rack up the highest engagement rates, shares, and comments.
Once you’ve identified these pillars—whether it’s behind-the-scenes tutorials, user-generated content features, or quick industry news breakdowns—you can build them into your content strategy with confidence. This data-backed approach takes the guesswork out of content creation, letting you double down on what your audience already loves.
This whole process is fundamental to figuring out what success actually looks like for your brand. You can learn more by exploring our detailed guide on how to measure social media success and start applying these principles to your own work.
Your Top Questions About Analytics Dashboards, Answered
Jumping into the world of advanced analytics always brings up a few questions. Even when the benefits seem obvious, you might still wonder how a real social media analytics dashboard is any different from the free tools you're already using, or how you'd even fit it into your day-to-day work.
Let’s clear up a few of the most common questions. My goal is to give you the clarity you need to make a smart decision and really get the most out of your data.
How Is This Different From Native Analytics?
This is a big one. "Why pay for a tool when Instagram and Facebook give me analytics for free?" It’s a totally fair question. The native tools are a decent place to start, giving you the basic numbers for their own platform. But you’ll hit their limits fast.
Think of it like this: native analytics show you a single puzzle piece. A dedicated dashboard lets you see the whole puzzle, fully assembled. It pulls all the pieces from every platform—Facebook, TikTok, Instagram, LinkedIn—and arranges them into one, clear picture. This is where you start spotting the cross-platform trends you’d otherwise miss completely.
A dedicated dashboard saves you from the mind-numbing task of logging into five different accounts and trying to stitch all that data together in a spreadsheet. It becomes the single source of truth for your entire social media strategy.
Instead of just knowing how a post performed on Instagram, you can compare it side-by-side with a similar post on Facebook, all in the same report. This bigger picture is where real strategic insights are born, letting you understand your audience and content on a much deeper level.
How Often Should I Check My Dashboard?
Another great question is about finding the right rhythm. How often should you actually look at your dashboard without getting totally lost in the numbers or overreacting to every little bump? The real answer depends on your goals, but having a structured routine is your best bet.
Most social media pros I know fall into a cadence that works incredibly well:
- Daily Quick Checks: A quick, 5-10 minute scan in the morning is perfect. You're just looking for big surprises—a post that’s suddenly blowing up or a weird dip in engagement that might need a closer look.
- Weekly Trend Analysis: Set aside a more focused block of time once a week. This is when you analyze performance trends, figure out what worked (and what flopped), and use that info to adjust the content calendar for the week ahead.
- Monthly Deep Dives: This is your big-picture review. Pull a comprehensive report to measure progress against your main KPIs, see how you stack up against last month, and shape your broader strategy for the next 30 days.
This approach keeps you from getting overwhelmed by data while still being responsive. You stop just reacting to numbers and start using them to actively guide your decisions.
Can a Dashboard Actually Calculate ROI?
And now for the million-dollar question—or at least, the one your boss is asking: "Can this thing actually calculate my social media return on investment (ROI)?" The answer is a huge yes, but only if you have the right tool.
Calculating social media ROI is all about connecting the dots between your posts and real business results. A powerful social media analytics dashboard makes this happen by tracking conversion-focused metrics right alongside your usual engagement data.
For instance, you can see exactly how many people clicked a link in a specific post, landed on your website, and then made a purchase or signed up for a newsletter. When you assign a dollar value to those actions, you can draw a straight line from your social media work to the money it brought in. This is how you shift the conversation from "we got a lot of likes" to "this campaign generated $5,000 in sales." It's how you prove, without a doubt, the business value of what you do.
Ready to stop guessing and start making data-driven decisions? PostSyncer provides all the tools you need in one powerful platform, from multi-channel analytics to AI-powered scheduling. Start your 7-day free trial today and see the difference for yourself.
