


Let's be honest, content marketing ROI isn't just another industry buzzword. It's the bottom-line number that tells you if your content is actually making money or just costing you money.
Think of it as the ultimate scorecard for your content strategy. It’s a straightforward calculation that compares the revenue your content brings in against what you spent to create and promote it, proving that your hard work translates into real business value, not just feel-good metrics.
Why Content Marketing ROI Matters More Than Ever
In a world where every marketing dollar is under a microscope, proving your worth is non-negotiable. When you can clearly calculate and present your content marketing ROI, you instantly shift the conversation. Your content efforts stop looking like a "cost center" and start being seen as a powerful "revenue driver" by the people holding the purse strings.
It's the difference between justifying your budget and watching it get slashed.
But it’s about more than just securing funds; it's about getting smarter with your strategy. Understanding your ROI is how you figure out which content formats, topics, and channels are hitting the mark and which are falling flat. Without that data, you’re basically marketing with a blindfold on.
Build Assets, Don’t Just Rent Attention
One of the best ways I've found to explain this concept is to compare content with paid ads.

- Paid Ads are like renting a billboard. The second you stop paying the rent, your ad comes down, and the visibility vanishes. It’s a temporary boost with zero lasting equity.
- Content is like building a house. Every blog post, video, or podcast you create is a digital asset that you own. It’s an investment that can appreciate over time, with a single evergreen article attracting organic traffic and generating leads for years to come.
This asset-building power is exactly why content marketing often delivers such a fantastic return. B2B marketers, for example, see an average 3:1 ROI—that's $3 back for every $1 spent. This kind of performance is why 82% of businesses now make content a core part of their strategy. It’s a proven engine for sustainable growth.
Tracking ROI isn’t just a backward-looking exercise to see what you spent. It’s a forward-looking tool that empowers you to make smarter, data-driven decisions that fuel predictable growth and prove marketing’s true impact on the bottom line.
Ultimately, getting a handle on your content marketing ROI turns your strategy from educated guesswork into a repeatable science. It lets you fine-tune your approach, double down on what’s working, and build a marketing machine that delivers long-term results. For more ideas on maximizing returns across all your campaigns, check out these proven strategies to improve overall marketing ROI.
The Fundamental Formula for Calculating Content ROI
Figuring out your content marketing ROI can feel a bit like trying to nail Jell-O to a wall. It sounds complicated, but at its core, the math is surprisingly simple. This isn't just some abstract theory—it's the practical calculation that connects your blog posts and videos directly to your bottom line.

The formula itself is straightforward:
ROI = (Return - Investment) / Investment * 100
This little equation spits out a percentage that tells you exactly how much profit you made for every dollar you put in. A positive number means you’re in the black. A negative one? Well, you’re losing money. The real trick isn't the math itself, but accurately defining what goes into "Return" and "Investment."
Breaking Down Your Total Investment
To get a real, honest-to-goodness ROI figure, you have to be brutally honest about your costs. Your Investment isn't just what you paid a freelancer; it's the sum of all expenses, both the obvious and the hidden ones. Too many marketers just count the direct costs, which leads to a dangerously inflated and misleading ROI.
Think of it like building a deck. You wouldn't just count the cost of the lumber. You'd also have to factor in the screws, the wood stain, the new saw you had to buy, and the value of your own time spent working on it all weekend. Content works the same way.
Before you can calculate your ROI, you need a crystal-clear picture of your investment. This table breaks down the typical costs you should be tracking.
Common Content Marketing Investment Costs
| Cost Category | Examples | How to Track |
|---|---|---|
| Direct Production Costs | Payments to freelance writers, graphic designers, video editors, voiceover artists, or agency fees. | Use accounting software or a simple spreadsheet to log all external contractor payments per project. |
| Software and Tools | Monthly/annual subscriptions for SEO tools (Ahrefs, Semrush), analytics platforms, scheduling tools (PostSyncer), and AI writers. | Keep a running list of all marketing tech subscriptions and their associated costs. |
| Paid Promotion | Ad spend on social media boosts, Google Ads, sponsored content placements, or influencer collaborations. | Track ad spend directly within each platform’s ad manager (e.g., Facebook Ads Manager, Google Ads). |
| Indirect Labor Costs | Prorated salaries of your in-house team members (marketers, designers, editors) based on time spent on content tasks. | Use time-tracking software or have team members log hours dedicated to content strategy, creation, and management. |
This kind of thorough cost-tracking is absolutely essential. The global content marketing industry is on track to hit $107 billion by 2026, but the data shows a worrying trend: while 83% of marketers say ROI is a priority, only 36% feel they measure it well. Closing that gap starts with getting a complete handle on your investment.
Calculating the Value of Your Return
Now for the other side of the equation: your Return. This is where things get a bit more nuanced because not every win comes from a direct sale. Your return is the total monetary value your content generates, and that can come in a few different forms.
For content that’s designed for a direct response, like a product landing page, the math is easy. You just track the sales that came directly from that page. Done.
But what about your blog posts, case studies, or white papers that are meant to generate leads? You need a different approach. The key is to figure out what a lead is actually worth to your business.
Here's how to do it:
- Calculate Your Lead-to-Customer Rate: Look at your historical data. What percentage of the leads you get from content actually end up becoming paying customers?
- Determine Customer Lifetime Value (CLV): On average, how much total revenue does a new customer generate for your business over their entire relationship with you?
Once you have those two numbers, you can calculate the value of a single lead with a simple formula: Lead Value = CLV x Lead-to-Customer Rate.
Just like that, every new lead your content generates now has a tangible dollar value. It’s no longer a vague metric; it’s a clear contribution to your bottom line. For a more detailed breakdown, check out our guide on how to calculate marketing ROI effectively.
Choosing KPIs That Actually Drive Business Goals
Figuring out your final content marketing ROI is the destination. But you can't get there without a good map. In marketing, Key Performance Indicators (KPIs) are your road signs, telling you if you're actually heading in the right direction. The real trick is learning to read the right signs while ignoring all the flashy, distracting billboards along the way.
It’s incredibly easy to fall into the trap of chasing vanity metrics. These are the numbers that look impressive on a report but don't mean much for the business—things like raw page views or your total follower count. A blog post with 10,000 views that generates zero leads is a failure. On the other hand, one with just 500 views that brings in three high-value customers is a home run.
True success in content marketing isn't about attracting the biggest crowd; it's about attracting the right crowd and guiding them toward a specific business outcome. Actionable KPIs are directly tied to these outcomes.
To pick the right KPIs, you have to connect them to the customer's journey, which we often visualize as a marketing funnel. Each stage of that funnel has a different goal, so it naturally needs different metrics to tell you if you're succeeding.
KPIs for the Awareness Stage
At the very top of the funnel, your goal is simple: get your brand on someone's radar. You're not going for the hard sell here. You're just making an introduction. Success at this stage is all about reach and visibility.
- Organic Traffic: This is the lifeblood. It tracks how many people find you through search engines. A steady climb here means your SEO work is paying off and you’re showing up for the right searches.
- Keyword Rankings: Are you on page one or page ten? Monitoring where you rank for target keywords tells you how visible you are to people actively looking for solutions you offer.
- Share of Voice (SOV): This isn't just about you; it's about you versus the competition. SOV measures your brand's visibility against your competitors, showing you how much of the conversation in your niche you truly own.
- Backlinks Acquired: Think of these as votes of confidence from other websites. The number of quality links pointing to your content is a huge signal of authority and a major driver of organic traffic.
KPIs for the Engagement Stage
Okay, you’ve got their attention. Now what? The next step is to hold it. The engagement stage is all about building a relationship and earning trust. Here, you're measuring how deeply people are interacting with what you’ve created.
Metrics to watch include:
- Time on Page / Dwell Time: This one’s straightforward—how long are people sticking around? Longer times usually mean your content is hitting the mark and providing real value.
- Bounce Rate: If someone lands on your page and immediately leaves, that's a bounce. A high bounce rate can be a red flag that your content didn't meet their expectations.
- Social Media Engagement: Don't get distracted by simple likes. Look deeper. Comments, shares, and saves show a much more active level of interest from your audience. For a more detailed look, you can explore specialized tools and techniques for social media analytics for business.
- Newsletter Sign-ups: When someone hands over their email address, they're giving you a direct line to their inbox. It’s a clear signal of trust and tells you they want to hear more.
KPIs for the Conversion and Loyalty Stages
This is where the rubber meets the road. At the bottom of the funnel, your content’s impact on revenue becomes crystal clear. You're measuring how well your content persuades people to take a valuable action, and then, how well you keep them around.
Essential KPIs for these bottom-funnel stages are:
- Lead Generation: This is about counting the qualified leads that come from specific content. Think eBook downloads, webinar sign-ups, or demo requests.
- Conversion Rate: This is the percentage of people who complete a goal, like making a purchase or starting a trial. It’s a direct measure of how persuasive your content really is.
- Customer Retention Rate: How many customers stick with you over time? Great content, like helpful tutorials or inspiring customer stories, can play a massive role in keeping them happy.
- Repeat Purchase Rate: For e-commerce brands, this KPI shows how effective your content is at encouraging customers to come back for more.
By picking KPIs that match each stage of the funnel, you build a clear, logical path from a person’s first impression all the way to a final, meaningful ROI calculation.
Making Sense of Content Attribution Models
How can you prove that a blog post someone skimmed six months ago is the real reason they finally bought something today? Cracking this puzzle is the entire point of content attribution, and it's the only way to get a true read on your content marketing ROI. Without it, you’re flying blind.
Think of your customer's journey like a soccer game. A potential customer might read one of your articles (the first pass), see a social post a few weeks later (a slick move in the midfield), and then finally click a link in an email to buy (the game-winning goal).
Attribution models are just different rulebooks for deciding who gets the credit. Does the glory go to the final shot? The very first pass that started the play? Or does every player who touched the ball deserve some recognition? The "right" answer depends entirely on which part of your team's performance you're trying to analyze.
The First-Touch Attribution Model
The First-Touch model is as simple as it sounds: it gives 100% of the credit to the very first piece of content a customer ever saw from you. Back to our soccer game, this is like giving the MVP trophy to the defender who made the initial pass that kicked off the entire scoring drive.
This model is a fantastic way to figure out which of your top-of-funnel channels are best at bringing new faces to your brand. If your main goal is awareness, First-Touch clearly shows you which blog posts, ad campaigns, or social media efforts are your best lead generators.
But its simplicity is also its biggest flaw. It completely ignores every other interaction that happened along the way, giving you zero insight into what actually nurtured that lead and pushed them toward a decision.
The Last-Touch Attribution Model
On the flip side, we have the Last-Touch model. This one gives 100% of the credit to the final touchpoint right before the conversion. In our analogy, this is the goal-scorer getting all the fame, even if their teammates did 99% of the work to get the ball down the field.
This is the default model in tools like Google Analytics because it's the easiest to track. It's great for pinpointing which bottom-of-funnel content—like a powerful case study or a direct email offer—is your best closer.
The problem? It massively undervalues all the crucial brand-building and educational content that got the customer ready for that final pitch. You could end up cutting the budget for a fantastic blog that warms up all your best leads, simply because it never gets the "last click."
The Multi-Touch Attribution Model
Let's be real—for most businesses, the customer journey is a winding road, not a single step. This is where Multi-Touch attribution models really shine, because they spread the credit across multiple touchpoints. It’s like admitting the goal was a total team effort.
There are a few popular ways to slice it:
- Linear: This model is the diplomat. It gives equal credit to every single touchpoint along the customer's journey, offering a balanced view that values each interaction.
- Time-Decay: Here, the touchpoints closer to the sale get more credit. The final click gets the most, the one before it gets a little less, and the very first interaction gets the least.
- U-Shaped (Position-Based): This model rewards the bookends of the journey. It gives the most credit to the first touch (for discovery) and the last touch (for conversion)—usually 40% each. The remaining 20% is sprinkled evenly across all the interactions in the middle.
This decision tree helps visualize how your main business goals should shape your content strategy and, by extension, your attribution focus.
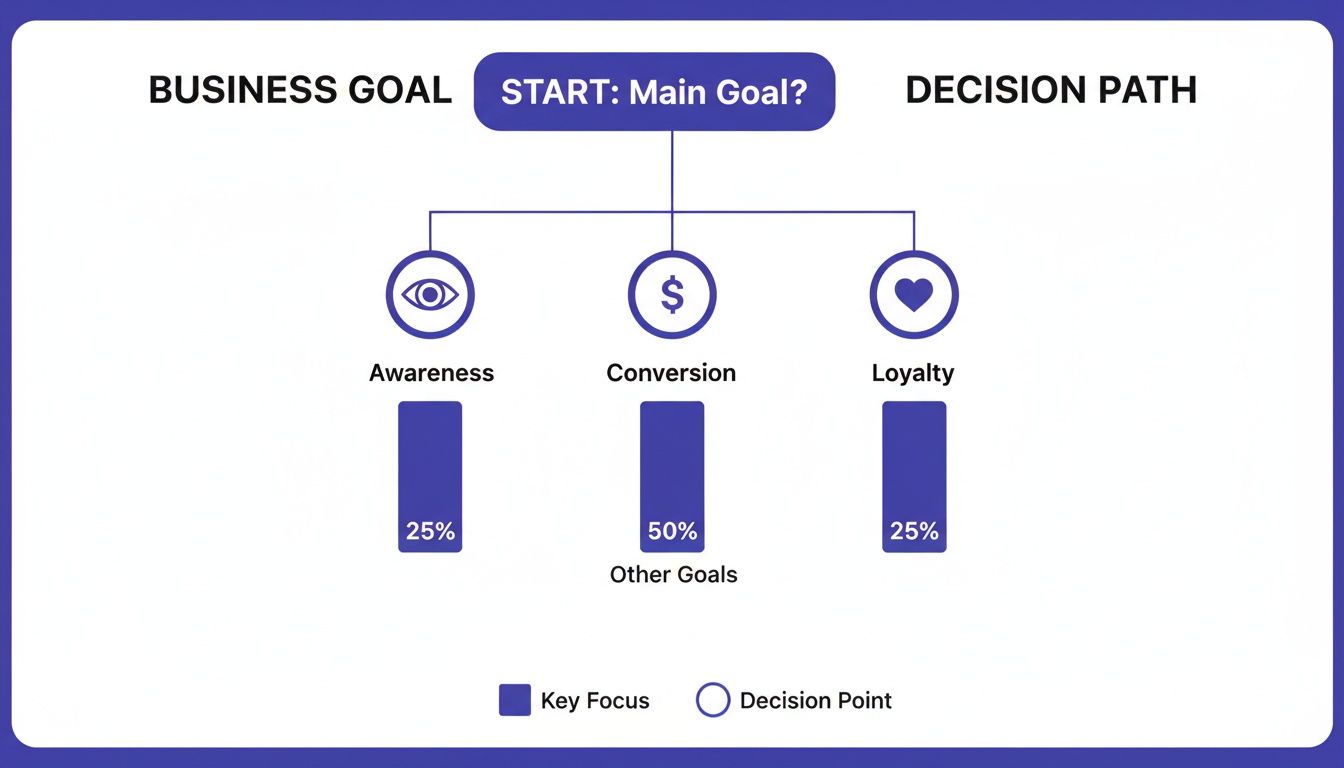
Whether you’re trying to build awareness, drive conversions, or foster loyalty, there’s a strategic content path—and an attribution model—to match.
Choosing the right model isn't about finding the "perfect" one—it's about finding the one that best reflects your typical customer journey and gives you the most actionable insights to improve your marketing.
Comparing Content Attribution Models
Understanding the pros and cons of different attribution models is key to deciding which best fits your business goals and sales cycle. This table breaks it down.
| Attribution Model | How It Works | Best For | Potential Pitfall |
|---|---|---|---|
| First-Touch | Assigns 100% credit to the first interaction. | Understanding which top-of-funnel channels drive initial awareness. | Ignores all mid- and bottom-funnel content that nurtures and converts leads. |
| Last-Touch | Assigns 100% credit to the final interaction before conversion. | Identifying your most effective "closing" content and channels. | Devalues the early and mid-stage content that built trust and interest. |
| Linear | Distributes credit equally across all touchpoints. | Getting a balanced, holistic view of the entire customer journey. | May overvalue minor touchpoints and undervalue pivotal moments. |
| Time-Decay | Gives more credit to touchpoints closer to the conversion. | Businesses with longer consideration phases where recent interactions are more influential. | Can minimize the importance of the initial awareness-building content. |
| U-Shaped | Gives 40% credit to the first touch, 40% to the last, and 20% to the middle. | Valuing both the initial lead source and the final conversion driver. | The middle interactions that nurture the lead can feel undervalued. |
Ultimately, for businesses with short sales cycles, like e-commerce, a simple Last-Touch model might be all you need. But for B2B companies with long, complex funnels, a Multi-Touch model is essential for seeing the whole story.
To make any of these models work, you need rock-solid tracking. To get started, you can learn more about using UTM variables in Google Analytics to see exactly where your traffic and conversions are coming from.
A Step-by-Step Framework for Measuring Your ROI
Knowing the formulas and KPIs is one thing, but actually putting it all together into a process you can repeat is what separates guessing from growing. Calculating your content marketing ROI shouldn't be a mad dash you do once a year. It needs to be a structured, ongoing part of your marketing operations that brings you consistent clarity.

This five-step framework turns ROI measurement from a monster of a task into a simple, manageable workflow. Think of it as your recipe for turning abstract data into real-world business intelligence.
Step 1: Define Crystal-Clear Objectives
Before you track a single click or view, you have to know what success actually looks like. Your objectives are the foundation of your entire measurement strategy. Without them, you’re just collecting numbers with no story to tell.
Start by asking the big question: "What business goal is this content supposed to achieve?" Your answers need to be specific, measurable, and tied directly to a real business outcome.
- Weak Objective: "Increase blog traffic."
- Strong Objective: "Increase organic blog traffic by 25% in Q3 to grow our top-of-funnel audience."
- Weak Objective: "Get more leads."
- Strong Objective: "Generate 150 marketing qualified leads (MQLs) from our new eBook campaign by the end of the month."
Clear objectives give your data a purpose and make that final ROI calculation truly mean something.
Step 2: Accurately Track All Your Investment Costs
If you want an honest ROI figure, you need an equally honest accounting of what you spent. This means tracking every single dollar—and hour—that goes into creating and promoting your content. As we covered earlier, this includes both the obvious and the not-so-obvious costs.
Keep it simple with a spreadsheet or use project management software to log expenses as they come up. Don't wait until the end of a campaign to try and backtrack—you’ll always miss something.
One of the most common pitfalls is underestimating or completely ignoring indirect costs, like the prorated salaries of your in-house team. This mistake leads to a dangerously inflated and inaccurate ROI number, which completely undermines the credibility of your report.
By meticulously tracking costs, you ensure the "Investment" part of your ROI formula is as solid as it can be.
Step 3: Set Up Your Analytics and Tracking Systems
This is where the magic happens—the technical backbone of your measurement framework. You absolutely need reliable systems in place to connect your content to specific actions and outcomes. If your tracking is broken or incomplete, your data is just noise.
Your essential tracking setup must include:
- UTM Parameters: Get into the habit of using campaign-specific UTM codes on every single link you share. This is what tells your analytics exactly which channel, campaign, and piece of content brought a visitor to your site.
- Conversion Goals: In Google Analytics, set up goals for every key action, like form submissions, newsletter sign-ups, or demo requests. Each goal is a valuable micro-conversion on the customer's journey.
- CRM Integration: This is the game-changer. Connect your website analytics to your Customer Relationship Management (CRM) system. This crucial link lets you follow a lead from their very first blog post view all the way through to a final sale.
With these systems firing on all cylinders, you’re no longer guessing where your leads and customers are coming from; you’re seeing it plain as day in your data.
Step 4: Analyze Performance Against Your KPIs
Now it's time to connect the dots. Take the data you're collecting and hold it up against the objectives you set back in step one. This means regularly monitoring the KPIs you picked for each stage of the marketing funnel. This is where a central dashboard becomes your best friend.
Instead of jumping between five different platforms, use a tool that pulls your key metrics into one spot. For social media, PostSyncer’s analytics dashboard lets you see engagement, reach, and click-through data together, while its campaign labeling feature allows you to group posts to measure the performance of specific initiatives.
This regular check-in helps you spot trends, see what’s resonating, and catch any problems before they can derail a whole campaign.
Step 5: Calculate and Report Your Final ROI
Alright, with all the pieces in place, you can finally and confidently calculate your ROI. Pull your total return figures from your analytics and CRM, subtract the total investment costs from your expense tracking, and plug them into the formula. As you get comfortable with this, it's also smart to think about measuring overall marketing effectiveness to see the bigger picture.
Present your findings in a clear, straightforward report that circles right back to the original business objectives. The goal here is to tell a story with your data—one that shows not just a final number, but how your content strategy directly fueled business growth.
Nailed down your content marketing ROI? That's a huge step, but the devil is in the details. Even with the best formulas, a few common slip-ups can quietly torpedo your numbers, leaving you with a skewed sense of what’s actually working.
These pitfalls are incredibly easy to fall into, but thankfully, they’re just as easy to sidestep once you know what to watch out for.
Think of it like building a house. You can have the perfect blueprint, but if you mis-measure a single load-bearing wall, the entire structure is compromised. The same goes for your ROI calculations—a small oversight can lead to wobbly strategic decisions down the line.
By getting ahead of these common measurement errors, you ensure your ROI figure isn't just a number, but a genuinely actionable piece of business intelligence.
Let’s walk through the most common traps and, more importantly, how to climb out of them.
Ignoring the Long-Term Value of Content
This is the big one. It's so tempting to treat a blog post like a paid ad campaign, check its ROI after 30 days, and declare it a flop if the numbers are low. This completely misses the point of evergreen content. It’s an asset, not a one-off promotion.
A well-crafted article might take 6-12 months just to start ranking on search engines and pulling in serious organic traffic. Its value compounds, generating leads and sales for years to come with zero extra investment.
How to avoid it:
- Expand your time horizon. Instead of a 30-day snapshot, measure the ROI of your core content pieces at the 6, 12, and even 24-month marks.
- Think in cumulative returns. Acknowledge that content is an asset that appreciates over time. Its true worth is the total value it generates over its entire lifespan.
Overlooking Non-Financial Returns
Focusing only on direct sales is a critical mistake. It completely ignores content's immense power to build your brand and earn audience trust. These top-of-funnel efforts—the articles, videos, and social posts that build awareness—don't always have a direct, last-click conversion tied to them, but they're incredibly valuable. They warm up your audience, making them far more likely to buy from you later.
Ignoring these contributions is like giving all the credit to the salesperson who closed the deal while forgetting the marketers who spent months building the company’s reputation in the first place.
How to avoid it:
- Use proxy metrics for brand awareness. Track the growth in branded search volume and direct website traffic. If more people are searching for you by name, your awareness content is doing its job.
- Assign value to brand lift. Calculate what it would have cost to get the same reach and impressions through paid ads. This helps you put a number on the "earned media" value of your organic content.
Using the Wrong Attribution Model
We've touched on this, but it’s worth repeating: choosing an attribution model that doesn’t fit your sales cycle will destroy your data's accuracy. A classic example is a B2B company with a nine-month sales process using a Last-Touch model. It gives zero credit to the blog posts, white papers, and webinars that nurtured that lead for months on end.
This single mistake often leads companies to slash budgets for crucial top- and mid-funnel content, simply because it rarely gets the final click before a purchase.
How to avoid it:
- Match the model to your funnel. For longer, more complex sales cycles, a multi-touch model (like Linear or U-Shaped) is non-negotiable. It distributes credit across all the interactions that guided the customer.
- Integrate your CRM. This is the key. Connecting your analytics platform to your CRM gives you a complete, 360-degree view of every touchpoint a customer had, from their first blog visit to the final sales call.
Frequently Asked Questions About Content Marketing ROI
Even with a solid framework, some questions about content marketing ROI always seem to pop up. These are the tricky, "what-if" scenarios that can stall progress. Let's tackle them head-on, so you can move forward with confidence.
How Long Does It Take to See a Positive ROI?
Let's be real: content marketing is a long game. It's more like planting a tree than flipping a switch. You'll likely see early signs of life—like traffic boosts and a few social shares—within the first couple of months. But a real, tangible financial return? You should give it at least 6 to 12 months.
This isn't an arbitrary timeline. It takes time for your content to climb the search rankings, earn trust from your audience, and gently guide people from "just browsing" to "ready to buy." The good news is that once that foundation is built, it becomes a powerful asset that keeps delivering value for years.
Can I Measure the ROI of Top-of-Funnel Content?
Yes, you absolutely can—you just have to look at it differently. It's tough to draw a straight line from a single awareness-stage blog post to a closed deal months later. Instead, we measure its impact using proxy metrics. Think of these as the early indicators that show your brand is gaining momentum and authority.
These are the KPIs that prove your top-of-funnel content is working:
- A rise in branded search queries: Are more people searching for your company by name? That’s a huge win.
- More direct traffic: People are typing your URL straight into their browser because they know who you are.
- Growth in social followers and share of voice: Your brand's presence and influence are expanding.
To put a dollar figure on it, you can calculate the "earned media" value. Figure out what it would have cost to get the same number of impressions and clicks through paid ads. Suddenly, that blog post's value becomes crystal clear.
What Are the Best Tools for Tracking Content Marketing ROI?
There's no single magic tool that does it all. The smartest approach is to build a "stack" where a few key tools work together to give you the full story.
The goal isn't to find one perfect platform, but to create a connected system. When data flows smoothly from the first click to the final sale, you get a complete, end-to-end view of your content's financial impact.
A rock-solid tracking setup usually includes:
- Web Analytics: Something like Google Analytics is non-negotiable. It's your source of truth for website traffic, user behavior, and on-site conversions.
- CRM Platform: A CRM like HubSpot or Salesforce is crucial for connecting marketing efforts to actual money. It tracks lead value, sales pipeline movement, and customer lifetime value (CLV).
- Social Media Management Platform: A tool like PostSyncer is where you connect social media activity to business goals. Its analytics and campaign tracking features let you measure the direct impact of your social content.
When these tools are integrated, you can finally attribute revenue back to the specific pieces of content that made it happen.
Ready to master your social media ROI? PostSyncer provides a unified dashboard with advanced analytics and campaign labeling to track performance and prove the value of your content. Start your free 7-day trial and see exactly what’s driving results. Get started at https://postsyncer.com.