


Let's be real for a second. Raw follower counts are just a vanity metric. They look nice on paper, but they don't pay the bills or build a loyal community. True social media engagement metrics are about the active conversation happening between you and your audience.
Think of your social media presence like a house party. Follows and likes are just people showing up and giving a polite nod. But the real magic happens in the comments, shares, and saves—that's where the deep, meaningful conversations are. Those are the moments that prove your content is actually hitting home.
Why Engagement Metrics Matter More Than Ever
In a world where everyone is screaming for attention online, understanding what actually makes your audience stop scrolling is a superpower. Engagement metrics are your compass. They guide your content strategy, showing you exactly what your audience loves so you can create more of it, and what's falling flat so you can ditch it.
This isn't just theory; it's a direct line into your audience's behavior. It lets you move beyond pure guesswork and start making smart, data-driven decisions that build a community that genuinely cares about what you have to say.
This focus on authentic interaction has become non-negotiable. With the recent flood of AI-generated content across social feeds, posts that spark genuine human connection are more valuable than ever. Social media algorithms have caught on, and they're now heavily favoring real conversations over sheer post volume. Success today isn't about how often you post, but how well you connect.
Moving Beyond Surface-Level Numbers
Just counting likes is an old-school move. Sure, a high like count feels great, but it barely scratches the surface of your content's real impact. To build a strategy that actually works, you need to look deeper into the four pillars of engagement. This framework gives you a much clearer picture of how people are really interacting with your brand.
Before we break them down, it's helpful to see them all in one place. These four categories tell a complete story about how your audience behaves.
The Four Pillars of Social Media Engagement
This table summarizes the core ways to think about engagement beyond just a simple "like."
| Pillar of Engagement | What It Measures | Example Metrics |
|---|---|---|
| Interaction | Direct actions users take on your post. | Likes, Comments, Reactions |
| Amplification | How users spread your content to their networks. | Shares, Retweets, Repins |
| Interest | Actions indicating a desire to revisit your content. | Saves, Post Clicks, Profile Visits |
| Conversation | The dialogue happening around your brand. | Comment Replies, Mentions, DMs |
Analyzing your content through these four pillars reveals powerful insights. For instance, a post might get few likes but a ton of saves. What does that tell you? It's likely a piece of high-value educational content that your audience wants to save and refer back to later. That's a huge win that you'd completely miss if you were only chasing likes.
“Engagement is more than just a number; it’s a reflection of the relationship you’re building with your community. Each comment, share, and save is a data point that tells you what your audience values, trusts, and wants to see from you.”
Ultimately, the goal is to get to the why behind the numbers. If you're ready to move past vanity stats and start building a real strategy, it's worth exploring guides on how to measure social media success beyond vanity metrics. This is how you turn raw data into a powerful growth engine and finally prove your social media ROI.
Decoding the Core Metrics You Need to Track
If you really want to figure out what makes your audience tick, you have to look past the surface-level numbers. It's time to dive into the specific social media engagement metrics that actually tell a story. Think of each metric as a clue that reveals how people truly feel about and interact with your content. Moving beyond simple likes is the first real step toward building a strategy that works.
Let's unpack the essential metrics that form the bedrock of any real social media analysis. These aren't just dry definitions; they’re about understanding the "why" behind the numbers.
This infographic gives you a great visual breakdown of the key metrics, showing how they all fit together to create a complete analytics picture—from basic awareness all the way to deep, meaningful engagement.
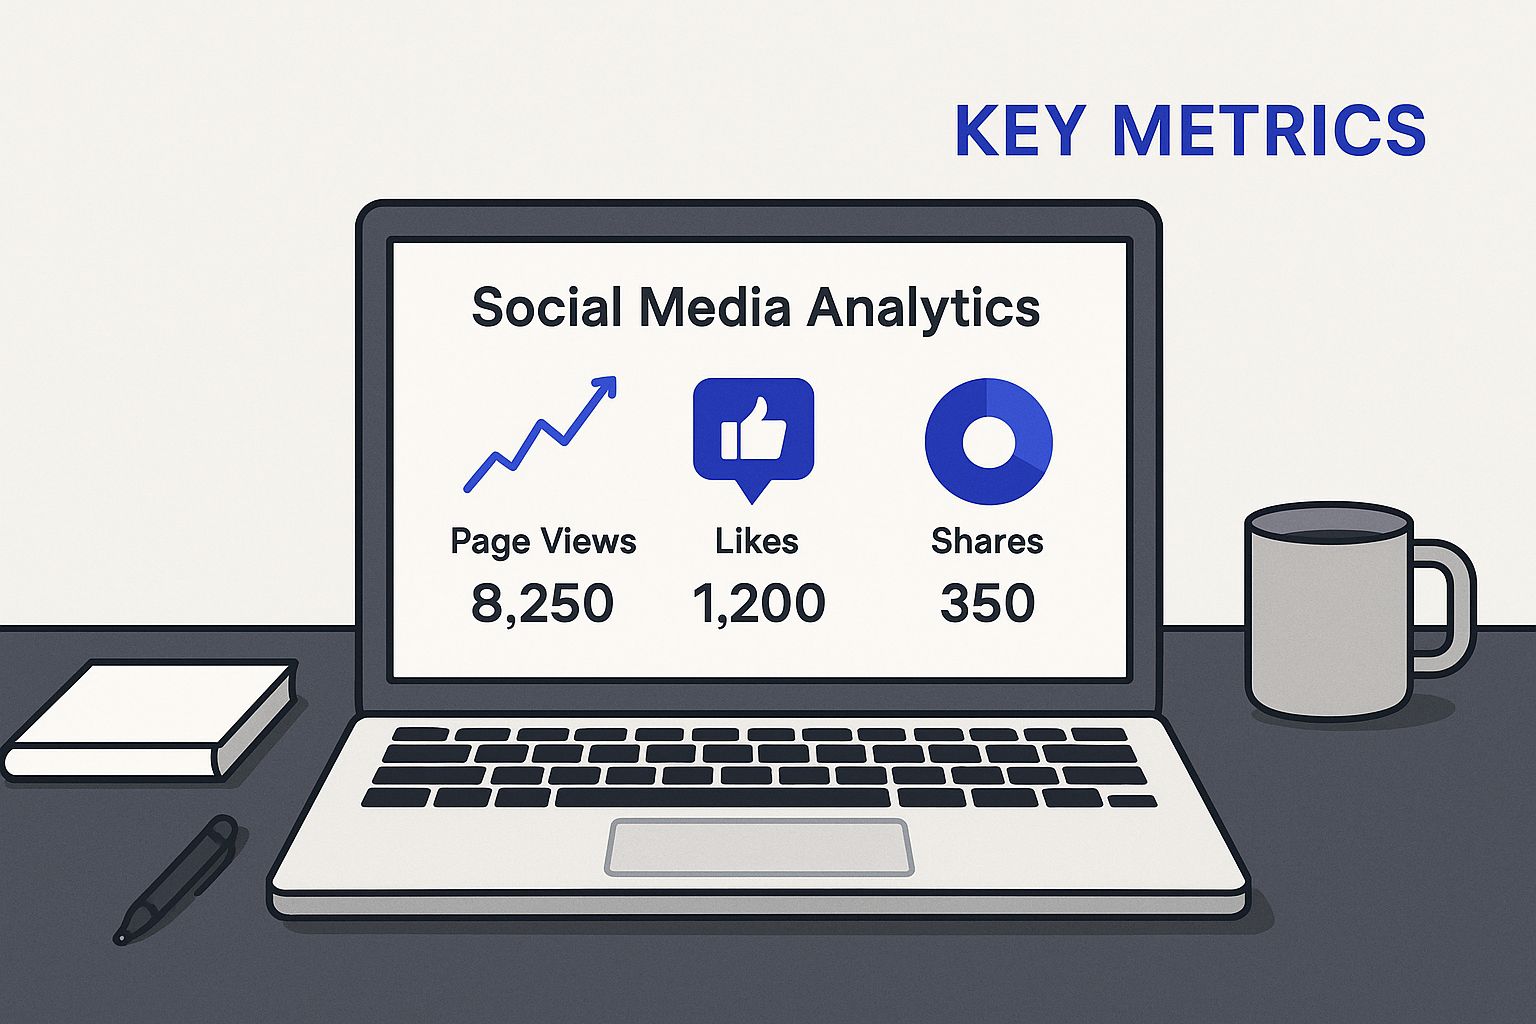
As you can see, a healthy social strategy isn't about chasing one specific data point. It’s built on a healthy mix of metrics that measure everything from raw visibility to genuine loyalty.
The Great Debate: Reach vs. Impressions
At first glance, Reach and Impressions sound like the same thing. They're not. Understanding the difference is crucial for knowing how visible your content truly is. Imagine you bought a billboard on a busy highway.
- Reach is the total number of unique people who saw your post. If 1,000 individual drivers see your billboard, your reach is 1,000.
- Impressions are the total number of times your post was displayed on a screen. If those 1,000 drivers pass your billboard twice each, you now have 2,000 impressions.
So why does this distinction matter so much? A high number of impressions paired with low reach tells you that a small, dedicated group is seeing your content over and over. That's not always a bad thing—it’s great for building brand recall. But if your main goal is brand awareness, you need high reach to make sure you're connecting with new potential customers. This is especially vital when you're analyzing paid ad performance, as it tells you if your budget is finding fresh eyes or just hitting the same people repeatedly.
Likes and Reactions: The Applause Meter
Likes are the most fundamental form of engagement. I often call them "applause" metrics. They’re a quick, easy nod of approval—a simple signal that someone found your content agreeable, funny, or just nice to look at. While they’re easy to rack up, they represent a pretty low level of commitment from the user.
But platforms like Facebook have evolved this with Reactions (Love, Haha, Wow, Sad, Angry). These give you a much richer layer of emotional feedback. A post that gets a lot of "Angry" reactions tells a completely different story than one full of "Love" reactions, even if the total count is identical. Digging into the type of reaction gives you a far more accurate pulse on how your audience is feeling.
A "like" is a polite nod from across the room. A comment is someone walking over to start a conversation. A share is them bringing their friends over to join in. Understanding this hierarchy is key to measuring what truly matters.
This idea of measuring what matters goes beyond just social media. To understand the wider business impact, you also need to track the key performance indicators (KPIs) for customer service, which often tie directly back to revenue.
Comments: The Conversation Starters
If likes are applause, then comments are full-blown conversations. This is where your community really comes alive. Comments signal a much higher level of engagement simply because they require more effort and thought than just tapping a button. They show your content was compelling enough to make someone stop scrolling, think, and type out a response.
Tracking comments is a must for a few key reasons:
- Audience Feedback: Comments are a direct pipeline into your audience's thoughts, questions, and honest opinions. This is pure gold for product development, content planning, and customer service.
- Community Building: When you take the time to respond to comments, you foster a sense of community and show people you're actually listening. That two-way dialogue is how you build trust and loyalty.
- Algorithmic Boost: Most social media algorithms see comments as a strong sign of high-quality, engaging content, which can reward your post with greater visibility.
A sudden spike in comments—whether they’re good or bad—is a big deal. It's a prime opportunity to engage directly with your audience and gather critical insights you simply can't get from any other metric.
Shares and Saves: The Ultimate Endorsements
When someone takes the time to share or save your content, they're giving it the ultimate vote of confidence. These actions sit at the top of the engagement pyramid because they signal deep value and trust.
Shares (or Retweets) are all about amplification. A user who shares your post is essentially vouching for your brand in front of their entire network. This is digital word-of-mouth marketing at its finest, extending your reach to new and often highly relevant audiences. Shares are a powerful sign that your content isn't just liked, but is considered worthy of a public endorsement.
Saves, which are huge on platforms like Instagram and Pinterest, are an equally powerful—though more private—metric. A save means your content is so useful or inspiring that the user wants to keep it for later. This is incredibly common for things like:
- Educational tutorials or how-to guides
- Recipes or workout plans
- Inspirational quotes or design ideas
- Product recommendations or wishlists
High save rates tell you that your content provides lasting value. It has moved beyond being a fleeting moment in the feed to become a genuinely useful resource. While shares boost your reach, saves build loyalty and position your brand as a go-to authority. Together, these two social media engagement metrics paint the clearest picture of content that truly hits the mark.
How to Calculate and Benchmark Your Engagement Rate

Knowing your engagement rate is like checking the vital signs of your social media presence. It’s a powerful number that goes way beyond just counting up likes or comments, giving you a standardized way to measure how compelling your content really is. But to get an accurate reading, you need to use the right formula for the job.
There isn't just one way to calculate this crucial metric. The two most common methods—Engagement Rate by Reach and Engagement Rate by Followers—each tell a slightly different story about your performance. Picking the right one just depends on what you want to figure out: the raw effectiveness of your content or the overall health of your community.
Calculating Engagement by Reach
I'd argue that Engagement Rate by Reach is the most honest measure of your content's quality. It tells you what percentage of the people who actually saw your post cared enough to interact with it. This method isn't thrown off by inactive followers or weird algorithm hiccups; it’s a direct reflection of how engaging your post was to its audience.
The formula is pretty straightforward:
(Total Engagements on a Post / Total Reach of the Post) x 100 = Engagement Rate by Reach (%)
For example, if a post reached 5,000 people and pulled in 250 total engagements (likes, comments, shares, you name it), the math would be: (250 / 5,000) x 100 = 5% Engagement Rate by Reach.
This formula is fantastic for judging individual posts and campaigns because it focuses only on the people who had a chance to engage. The only catch is that reach can fluctuate wildly, making it a less stable metric for tracking long-term, account-wide health.
Calculating Engagement by Followers
The other popular method is Engagement Rate by Followers. This calculation measures the percentage of your total follower base that engages with your content, on average. It gives you a much more stable, consistent benchmark for tracking the responsiveness of your community over time.
The formula for this one looks like this:
(Total Engagements on a Post / Total Followers) x 100 = Engagement Rate by Followers (%)
Using this method, if you have 10,000 followers and a post gets 250 engagements, your rate is: (250 / 10,000) x 100 = 2.5% Engagement Rate by Followers.
While this is a great metric for tracking consistency, its main drawback is that it doesn’t account for how many of your followers actually saw the post. Your reach on any given day might only be a small fraction of your total follower count, which can make this rate seem artificially low.
Setting Your Benchmarks
Once you start calculating your engagement rate, the next logical question is: is it any good? Benchmarking is the process of giving your numbers some much-needed context. Without it, you’re just staring at data in a vacuum.
There are three key ways to set effective benchmarks:
- Historical Performance: This is your most important benchmark, period. Your main goal should be to get better than you were last month. Track your average engagement rate month-over-month to see if your strategy is actually working.
- Competitor Performance: Keep an eye on your direct competitors. A quick analysis of their public engagement gives you a realistic idea of what’s possible in your specific niche.
- Industry Averages: Broader industry reports provide a general sense of how things are going across different platforms. This data helps you manage expectations, especially if you're just breaking into a new market.
Speaking of industry trends, it’s crucial to know that overall engagement has been shifting. A recent Social Media Industry Benchmark Report found that every major platform saw engagement drop. Facebook’s rate fell by 36%, Instagram’s by 16%, and X (formerly Twitter) saw a massive 48% decrease. Knowing these trends helps you set realistic goals in a tougher digital space. You can dig into these numbers by exploring the complete social media benchmark report.
Ultimately, a "good" engagement rate is relative. By combining these different formulas and benchmarking approaches, you can build a detailed and nuanced picture of your performance. For a broader look at tracking your efforts, you might find our guide on how to measure social media success helpful in building a complete framework.
Choosing the Right Tools for Tracking Metrics
Understanding your social media engagement metrics is one thing, but actually tracking them is a whole different ball game. To get out of the spreadsheet and into a real workflow, you need the right tools for the job.
Think of it this way: you have a toolbox. You wouldn't use a wrench to hammer a nail. The same logic applies here. The best analytics tool for you is the one that fits the specific job you need to get done.
Your first stop should always be the free, surprisingly powerful analytics tools baked right into the social platforms themselves. These native tools are your ground zero, offering a direct, unfiltered look at how your content is performing on each network.
For example, Meta Business Suite gives you a single dashboard for both Facebook and Instagram, showing you everything from reach and engagement to who your audience actually is. TikTok Analytics is your go-to for video views and follower trends, while LinkedIn Analytics drills down into the professional engagement and B2B growth metrics that matter on that platform. Honestly, these are non-negotiable for any social media manager.
Native Tools Versus Third-Party Platforms
While native analytics are fantastic, they have one major drawback: data silos. Constantly jumping between different dashboards to stitch together a complete picture of your performance is a massive time sink. It’s clunky and inefficient. This is exactly where third-party platforms come in to save the day, acting as a central command center for all your social data.
A great third-party tool takes all your scattered data points and weaves them into a single, cohesive story. It's the difference between staring at a pile of puzzle pieces and seeing the finished picture, revealing how your entire strategy connects.
Platforms like Sprout Social, Hootsuite, and Rival IQ were built to solve this exact headache. They pull data from all your social profiles into one unified dashboard. Suddenly, you can track cross-channel campaigns, compare performance between platforms, and generate comprehensive reports without all the manual copy-pasting.
What’s driving marketers to use these tools? A recent Sprout Social report sheds some light on the goals that matter most, which directly influences the tools they choose.
As you can see, proving ROI and generating leads are at the top of the list—tasks that often demand more horsepower than native tools alone can provide.
How to Select the Right Social Media Tool
So, how do you pick the right tool from the bunch? Simple: match the tool's strengths to your most important goals.
For All-in-One Management and Reporting: If your days are filled with managing multiple accounts, scheduling content, and building reports for your boss, a comprehensive platform like Sprout Social or Hootsuite is your best bet. They’re built to streamline the daily grind for busy teams.
For Deep Competitive Analysis: If you’re more focused on benchmarking your performance against the competition and spotting industry trends, a specialized tool like Rival IQ is a game-changer. It’s designed to show you exactly where you stand in your market.
For Streamlined Content Operations: If your main priority is just getting great content created, scheduled, and published efficiently, you need a tool that ties those pieces together. To see how this workflow comes to life, check out our guide to help you master your social media content strategy in 2024.
Ultimately, choosing between native tools and a third-party platform isn't an "either/or" situation. The smartest social media managers use both.
Start with your native analytics to get a feel for the unique quirks of each platform. Then, layer on a third-party tool to centralize your data, automate reporting, and get that crucial big-picture view. This one-two punch gives you the detailed insights and the strategic overview you need to drive real growth.
Understanding Advanced and Emerging Metrics

Once you’ve gotten a handle on the basic engagement numbers, it’s time to level up. The real magic happens when you start looking at a more sophisticated layer of social media engagement metrics. These advanced metrics stop looking at raw counts and start measuring the relative impact of your content.
Think of it this way: raw numbers tell you what happened, but these advanced rates tell you how effective it was. This is where you can finally start to see how efficient your content is and pinpoint what truly resonates with your audience, regardless of how many people saw a particular post.
The Three Rates of Engagement
To get a clearer picture of your performance, it helps to break engagement down into three distinct rates. Each one tells a different part of the story, giving you a focused look at how your audience is actually behaving.
Applause Rate: This is all about simple approval—your likes and reactions. It answers the question, "Of all the people who saw this post, how many gave it a quick nod of appreciation?" It’s a great, straightforward benchmark for audience approval.
Conversation Rate: This metric zeroes in on the dialogue your post creates. It only looks at comments, telling you how many people were inspired enough to stop scrolling and actually join the conversation. It's a fantastic indicator of your community's health.
Amplification Rate: Think of this as your digital word-of-mouth. It tracks how often your content gets shared, showing how many people found it valuable enough to pass along to their own networks. A high amplification rate is a powerful sign of brand loyalty.
A post with a high applause rate but a low conversation rate might be nice to look at but lacks a hook to draw people in. On the other hand, a post with tons of conversation but few shares might be great for your core fans but isn't traveling any further. Looking at these rates together reveals the full picture.
If you find your numbers are lagging in certain areas, it's a sign you need a more targeted plan. For anyone struggling with low conversation or amplification, it's worth taking the time to learn more about how to improve social media engagement with some proven strategies.
Emerging Trends Shaping the Future of Engagement
The social media world never sits still, and new trends are always changing the game. Right now, two of the biggest shifts are the explosion of AI-driven content and the fascinating rise of virtual personalities.
The widespread adoption of AI has completely changed how content gets made. We’re already seeing the impact: 90% of businesses using generative AI report saving a significant amount of time. Even better, 73% are seeing a real lift in their engagement rates from AI-assisted content.
Another trend that’s impossible to ignore is the emergence of AI influencers. These are completely digital personalities who are building huge followings and landing deals with major brands. This virtual influencer market is rocketing upward, projected to become a massive $37.8 billion industry by 2030. You can discover more insights about these social media statistics on Talkwalker.com. Staying on top of trends like these is absolutely critical for any brand that wants to stay relevant and connect with audiences in new ways.
Got Questions About Engagement Metrics? We’ve Got Answers.
Even after you get the hang of the basics, putting social media engagement metrics into practice can feel a bit fuzzy. It’s one thing to know the definitions, but it’s another to know what to do with them.
This section is all about clearing up those common sticking points. Let's tackle the questions we hear all the time so you can get back to what matters: building a real connection with your audience.
What Is a Good Social Media Engagement Rate?
Everyone wants a magic number, but the honest answer is: there isn’t one. A "good" engagement rate is completely relative. It depends on your industry, the platform you're on, and what you’re trying to accomplish. You’ll often hear people throw around 1-5% as a general benchmark, but that number can be seriously misleading.
Think about it. A nonprofit sharing a heart-wrenching story will naturally get a different kind of engagement than a B2B software company announcing a new feature. The only benchmark that truly matters is your own.
Stop chasing arbitrary industry averages. The real win is seeing a steady, upward trend in your own engagement rate over time. Your goal should be to outperform your past self.
This mindset keeps you focused on realistic growth and lets you see the true impact of your strategy tweaks.
How Often Should I Check My Engagement Metrics?
Checking your metrics too often is a surefire way to get overwhelmed and make knee-jerk decisions. On the flip side, not checking them enough means you're flying blind. The key is to match your review frequency to your goals.
Here’s a simple, sustainable rhythm we recommend:
- Daily Scan: This is for community management, not deep analysis. Take a quick look at comments, mentions, and DMs. The goal here is to be responsive and keep conversations alive.
- Weekly Review: This is your time to spot content trends. See what hit the mark over the last seven days and what didn't. Use these insights to guide next week's content plan.
- Monthly or Quarterly Deep Dive: This is where you zoom out and think strategy. Use these bigger-picture reviews to measure your overall progress, calculate your ROI, and make informed decisions about your social media presence.
Which Engagement Metric Is the Most Important?
This is a classic question, but it’s a bit of a trick one. The "most important" metric is whichever one aligns directly with the goal of a specific post or campaign. There’s no single winner—the value of a metric is defined by your objective.
A smart social media strategy doesn't treat all engagement equally. Instead, it matches the metric to the desired outcome.
Consider these common goals:
- Goal: Build Community? If you want to create a loyal, talkative audience, Comments are your north star.
- Goal: Boost Brand Visibility? To get your name in front of fresh eyes, you need to prioritize Shares. This is your amplification rate in action.
- Goal: Provide Real Value? If you're sharing educational or helpful content, Saves are the ultimate compliment. It means your audience found your post so useful they want to come back to it later.
Ready to stop guessing and start growing? PostSyncer gives you a simple, all-in-one dashboard to track every engagement metric that matters. See what’s working, understand your audience, and prove your ROI without the headache. Start your free trial today and see the difference.