











You can have traffic coming in, campaign spend holding steady, and a dashboard full of green numbers, yet still feel stuck. Sign-ups flatten, trials don't turn into active users, carts get abandoned, and the report tells you the total conversions are weak without showing where the journey broke. That's the gap funnel analysis fills, and it's the reason a team can keep optimizing the wrong thing while the leak stays hidden.
The fastest way to make sense of that leak is to stop reading the dashboard as a single scorecard and start reading it as a sequence of actions. If you need a broader view of customer behavior alongside the funnel itself, a customer intelligence platform by Mara is a useful complement because it helps teams connect behavior, context, and lifecycle signals instead of staring at totals in isolation.
Why Your Numbers Look Fine but Growth Feels Stuck
A funnel can look healthy on paper while the business still feels stuck. Traffic may be steady, clickthroughs may hold up, and the dashboard may stay green, yet people keep dropping out between the steps that matter. A homepage can bring in visits, a pricing page can attract attention, and a checkout page can receive traffic, but if the handoff between those stages keeps breaking, the final report hides the problem instead of explaining it.
The trap of watching totals instead of stages
The mistake usually starts with the biggest number on screen. A marketer sees more visitors and pushes harder on acquisition. Sign-ups stay flat, so the landing page gets rewritten. Sales still miss target, so the team asks for more leads. Each move sounds reasonable on its own, but none of them answers the same question, and the actual loss may be happening somewhere else in the path.
That is why funnel reporting is a standard part of product and marketing analytics platforms. It helps teams find friction in websites, apps, email journeys, and e-commerce flows by showing where people stop moving forward, not just where the final conversion lands. The name comes from the way the audience narrows at each stage as described in this funnel analysis guide.
Practical rule: if the dashboard points to a conversion problem, the first question should be, “Which step is breaking the path?”
A funnel turns a vague concern into a specific question. Instead of saying growth is weak, you can say people are entering the flow but too many never reach the next event. That matters because it shifts the work from broad guesswork to focused diagnosis. In a SaaS signup flow, that might mean users start registration but never finish email verification. In social campaigns, it might mean people click through from an ad but never complete the next action. In e-commerce, it might mean product views are strong while add-to-cart and checkout completion fall apart.
What this guide is trying to solve
The job is bigger than drawing a neat diagram. You need to decide whether the drop-off is significant, which stage owns the loss, and how to read funnels when customer journeys no longer behave like a straight line. That question matters in SaaS, social, and e-commerce, where the same person may research, return later, compare options, and convert across more than one session.
A good funnel read gives you a system, not just a chart. It shows where the path narrows, which stage is responsible for the loss, and what evidence you need before changing the experience. It also keeps the team honest about trade-offs, because a stage with low conversion is not always the stage that deserves the fix.
The Core Idea Behind Funnel Analysis
A coffee shop makes the idea easier to see than a dashboard ever will. People walk past the storefront, notice the menu, step inside, order, and come back again. At each step, the crowd gets thinner. That thinning is the core logic of funnel analysis.

From a vague goal to a measurable path
In analytics terms, a funnel is an ordered event-sequence model. It does not just count visits. It counts how many unique users move from one predefined stage to the next, then calculates step-to-step conversion and drop-off rates as explained by Amplitude. That is why it works so well for linear workflows like signup, onboarding, checkout, and lead capture.
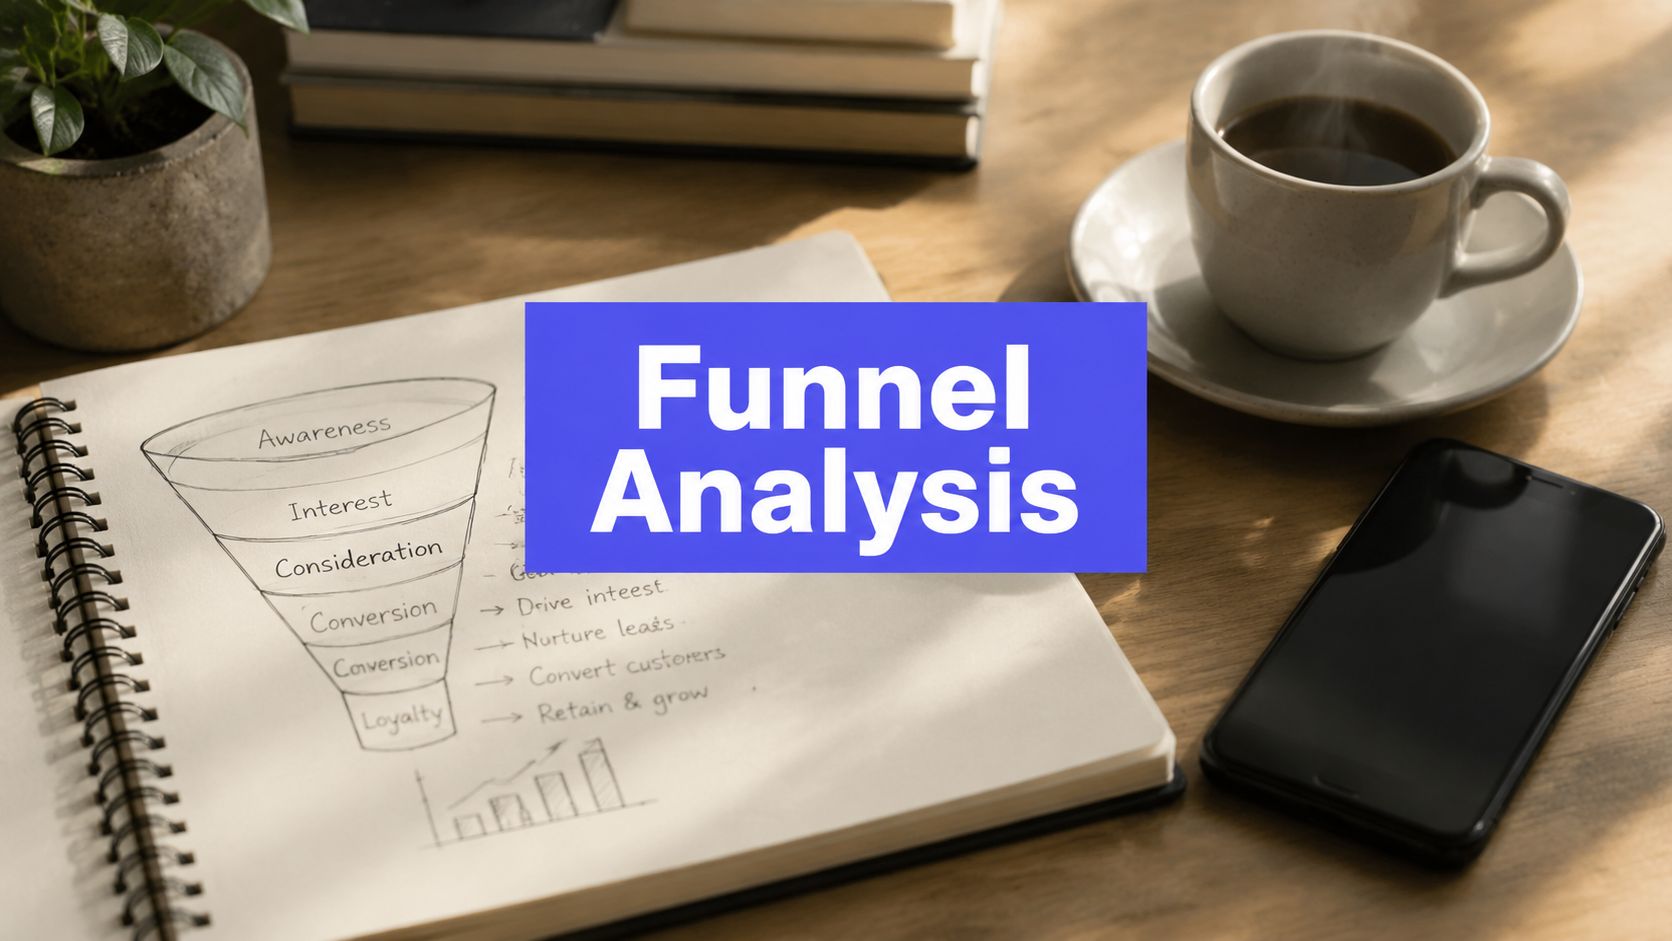
Working best when the funnel stays simple is a common principle. AIDA, meaning Awareness, Interest, Desire, Action, is one familiar structure, and experts commonly recommend 3 to 5 measurable steps so the analysis stays actionable. Too many steps create noise. Too few can hide a significant leak.
The coffee shop example makes the trade-off obvious. If you only track “people who bought coffee,” you learn almost nothing about why one day is weak. If you track passersby, notice menu, walk in, order, and return, you can see exactly where the crowd thins out. That same logic applies to a SaaS signup flow, a paid social landing page, or an e-commerce checkout.
Why every step costs you people
Every extra step reduces the number of users who reach the end. That is the basic statistical principle behind funnels, and it is why a small loss early in the path can matter so much later. A funnel is not a decorative diagram. It is a measurement system for a business goal.
The right question is not whether you have a funnel. You do. The harder question is whether you have defined it well enough to read it correctly.
When the sequence is clear, the analysis becomes practical. You can test the menu sign, the doorway, the ordering flow, or the return experience separately instead of guessing at the whole system at once. That is where the core work begins.
Stages, Events, and the Metrics That Matter
A funnel only makes sense when the stage, the event, and the metric point to the same moment in the journey. The stage is the outcome you care about. The event is the action that shows someone moved into that outcome. The metric is the proof that the handoff held together, or broke.
A common source of confusion is mixing those three up. For example, a SaaS team may treat “trial started” as a stage, but the event that proves it could be a completed signup form, while the metric that matters might be the share of users who reach activation after that. In e-commerce, “checkout started” is not the same as “payment submitted,” and in social campaigns, “landing page view” is not the same as “lead captured.” Once those roles blur, the funnel starts to look neat on paper and misleading in practice.
What each metric family answers
Conversion rate is the first number many teams check because it is easy to read. It shows movement from one step to the next, but it does not explain why that movement changed or whether the business is healthy behind the scenes. Funnel reporting often tracks conversion rate, drop-off rate, time between steps, CAC, CLV, churn, average deal size, and sales velocity because each one answers a different business question as outlined in Popupsmart's funnel metrics guide.
| Funnel Metrics and What Each One Tells You | |||
|---|---|---|---|
| Metric | What it measures | Question it answers | Where to look |
| Conversion rate | The share that moves from one step to the next | Which handoff is working best or worst? | Event-to-event funnel view |
| Drop-off rate | The share that leaves at a given step | Where are people stopping? | Stage breakdown |
| Time between steps | The delay between actions | Are users stalling or moving smoothly? | Cohort timing and journey timing |
| CAC, CLV, churn, sales velocity | Business efficiency and retention quality | Is the funnel healthy financially? | CRM, revenue, and lifecycle reporting |
These metrics do different jobs, so they should not be read as substitutes for one another. A social campaign can show strong click-through rates while producing weak CAC if the clicks never become revenue. A SaaS signup flow can look healthy on conversion rate while churn later reveals that the wrong users entered the funnel. An e-commerce checkout can keep moving if the product is right, yet still show poor sales velocity if shipping friction slows the entire path.
Why the same drop-off can mean different things
A 40% drop at checkout might be fine in one setting and a warning sign in another, but the number alone cannot tell you which. Mobile shoppers, first-time buyers, and low-trust offers behave differently from returning desktop buyers. The metric matters, but context matters more.
That is why funnel analysis works best as a handoff system, not as a single score. A step that loses people might point to a payment issue, a trust issue, a shipping issue, or a mismatch between the audience and the offer. Analysts at a B2B team might find that one stage looks weak only because sales followed up too late. An e-commerce team might see the same pattern and find that shipping costs appeared too late in the flow. A social team reading a social media analytics report template might spot a strong top-of-funnel click rate but poor downstream quality, which means the problem sits in the handoff, not the ad itself.
The metric tells you the break exists. The surrounding evidence tells you what kind of break it is.
How to Set Up a Funnel You Can Trust
A trustworthy funnel starts with clean definitions, not with a fancy chart. The setup is simple in theory, but the details matter because inconsistent event naming can make one tool say a step happened while another tool says it didn't.

A five-step setup that keeps the chart honest
Start with the goal event. If the goal is purchase, define purchase in plain English so everyone agrees on what counts. Then list the ordered actions that lead there, pick a reporting window, validate the events in raw data, and segment before you draw conclusions. For a social team, that might mean using a social media analytics report template to separate the clicks that matter from the clicks that only look good on a dashboard.
That reporting window matters more than many teams think. Baseline data should be in place long enough that random noise does not look like a real drop-off. If you change the page too soon, you may end up “fixing” a wobble that would have disappeared on its own.
One primary source per action helps too. Practitioner guidance keeps pointing back to the same principle, use one reporting source for each core action, document definitions in plain English, and pair the funnel with qualitative evidence when the stack is fragmented. If the same action is counted differently in two tools, the funnel stops being a diagnostic and starts arguing with itself.
Operational rule: write the definition first, then the event, then the report. Never the other way around.
Where teams usually go wrong
The most common failure is not technical, it's definitional. “Started checkout” can mean a page view in one tool, a button click in another, and a form submission in a third. That is how a funnel gets noisy before it ever gets useful.
A clean setup pairs quantitative tracking with behavior evidence, such as heatmaps, session recordings, form analytics, and on-page surveys. That combination helps you tell the difference between a real drop-off and a tracking artifact, which is the difference between a useful funnel and a misleading one.
Funnel Analysis in the Wild Across Three Real Scenarios
A funnel can look tidy on a slide and still fail in practice. The shape stays the same, but the point of loss changes depending on whether you are tracking a SaaS trial, an e-commerce purchase, or a social campaign. That is why the first job is not drawing the funnel, it is identifying where friction lives.
SaaS free trial
A SaaS team can look at landing-page traffic and miss the problem entirely. The landing page may be doing its job, the pricing page may be doing its job, and the leak may happen later, between email verified and workspace created. That stage definition matters because it separates activation from acquisition, which is where many trial funnels get misread.
A trial start is only the opening signal. The first meaningful product action is the one that shows whether the user has crossed from curiosity into use, and that is the step worth tracking.
E-commerce checkout
E-commerce teams often focus on the cart-to-checkout move because it is the most visible break in the path. The larger loss can happen later, at payment, where a form field, a missing trust cue, or an unexpected cost causes people to leave. A funnel that stays too broad hides that distinction.
A useful checkout funnel usually separates product view, cart, checkout start, payment step, and order completion. That structure helps the team avoid spending time on the wrong screen when the friction sits deeper in the process. If the cart looks healthy but payment falls apart, the fix belongs at payment, not at the product page.
Social media campaign
Social funnels behave differently again. Reach can stay steady while saves and shares fade, which means the post is being seen but not prompting enough action. That points to a content and distribution problem, not a traffic problem.
The same logic applies to publishing workflow. If the team cannot see which formats earn engagement, it is hard to tell whether the post underperformed because of timing, creative, or audience fit. A tool like PostSyncer's social media analytics tools can help connect post type, timing, and performance instead of treating every impression as equal.
One useful way to read these examples is to ask a simple question: which stage owns the loss? A SaaS funnel may lose users at activation, an e-commerce funnel may lose them at payment, and a social funnel may lose them after reach but before meaningful engagement. That question is often clearer when the team also checks real-time analytics for funnel validation, because a live shift in behavior can reveal whether a drop is a genuine pattern or just a temporary wobble.
Each case points to the same habit. Define the stage that owns the loss, not the stage that is easiest to report.
Why Linear Funnels Mislead in 2026 and How to Read Around It
A buyer can look perfectly on track in a funnel chart and still be nowhere near a decision. Someone sees a social ad on mobile, leaves, checks reviews on desktop later, returns through email, and converts after a different touchpoint entirely. The path is still there, just not in the tidy order the textbook diagram expects.

Three ways the linear view breaks
The first problem is device mixing. A mobile visitor may browse, pause, and return later on desktop, so one blended conversion rate can hide where the friction lives. A second problem is timing. Users who move slowly between steps often behave differently from fast movers, and a single average can make those groups look more similar than they are. The third problem is attribution. If you only count the last visible step, the research that happened across search, social, and email disappears from view.
That is why analysts are pushed to segment by traffic source, device, new versus returning users, and cohort timing as recommended by VWO and echoed in Contentsquare's guidance. Segmentation is not decoration. It is the correction that keeps the funnel from flattening different behaviors into one average.
Operations teams use the same logic when they try to separate signal from noise. Pairing funnel charts with heatmaps, session recordings, form analytics, and surveys helps them check whether the drop-off is real and where it starts to break down. In fast-moving teams, a live check from what real-time analytics adds to funnel reading can show whether a dip is a pattern or just a short-lived wobble, which matters when behavior shifts across devices and channels.
Reading the funnel as a diagnostic
A funnel chart is a clue, not a ruling. It points to the stage that needs a closer look, but it does not explain the full story on its own. Strong analytics teams use it the way a mechanic uses an alert light, as the place to start, not the final answer.
In social, that might mean reach stays steady while saves and shares fall, so the content is being seen without enough action. In SaaS, it can mean signups arrive but activation stalls because the onboarding step is confusing. In e-commerce, the cart can look healthy while payment loses the sale, which tells you the issue belongs deeper in the flow. The funnel still matters, but only if you read it alongside the supporting evidence instead of treating a straight line as the whole customer journey.
Tools, Templates, and Your First 90 Days of Funnel Work

A funnel only stays useful if the team can keep it consistent. Product analytics platforms fit event-level journeys, web analytics suites work better for content and acquisition funnels, and CRM or revenue tools belong in sales and lifecycle reporting. If three tools count the same action in different ways, the numbers will argue with each other before anyone can decide what to fix.
A practical starter plan
Start with one funnel and one team. In the first 30 days, define the steps and instrument them carefully. In the next 30, break the results out by segment and timing so you can see whether the loss is concentrated in one audience or one moment. In the final 30, ship one change per cycle and report what moved. That rhythm keeps the work small enough to trust and fast enough to matter.
The tool stack should match the question. Product analytics helps with ordered event sequences, web analytics handles acquisition and content paths, and A/B testing tools help confirm whether a change improved the step that was leaking. For teams comparing social publishing, campaign performance, and audience behavior, PostSyncer's social media analytics tools can help keep reporting in one place instead of scattered across exports.
The easiest mistake to avoid is spreading ownership too thin. Pick one funnel, define it in plain English, and keep the same definitions while you iterate. If the measurement changes every time the team changes the page, you will not know whether growth improved or the reporting moved.
A concise way to keep it useful
- Define one journey: choose one goal and one owner so the work does not sprawl.
- Document the steps: write each event in plain English before building the report.
- Measure consistently: keep the same source of truth for each core action.
- Ship one change: test one adjustment, then read the funnel again.
For social teams that need a repeatable workflow, use tools that make it easy to compare what was published with what happened afterward. That is where a good toolset helps the team move from scattered screenshots to a shared read on performance.
Start with one funnel, keep the definitions clean, and review it every week until the numbers and the behavior tell the same story. If you want a place to plan, publish, and measure without losing sight of what is moving the result, PostSyncer gives you that structure.