


Let's get one thing straight: client engagement metrics are the numbers that tell you if anyone is actually listening to what you're saying on social media. It's about way more than just counting likes. These are the data points that peel back the curtain, showing you the real connection—or lack thereof—your audience has with your brand.
This is the stuff that matters, signaling true value that a simple follower count just can't touch.
Why Client Engagement Metrics Matter More Than Followers
For too long, the social media world was obsessed with follower counts. It was a vanity game—big numbers looked impressive on a report but rarely did much for the bottom line. A massive follower count doesn't pay the bills, and it’s time we moved past that outdated mindset.
This guide is all about focusing on what actually drives a business forward: genuine audience connection.
Tracking the right engagement metrics is how you prove your social media efforts are working and build a community that sticks around. Think of it less like you’re shouting from a stage and more like you're having a real conversation. Every comment, share, and save is a vote, a piece of feedback telling you exactly who your best people are and what content truly hits home for them.
Moving from Vanity to Value
The entire digital marketing world has finally woken up to this reality. While your follower count might show how many people you could reach, engagement shows how many people you actually reach.
A brand with 10,000 highly engaged followers has a thriving community. A brand with 100,000 silent followers has an empty stadium. One is an asset; the other is just a number.
When you dial in on client engagement, you can:
- Find Your Superfans: You’ll quickly see who consistently interacts with your posts. These are the people most likely to become loyal customers and tell their friends about you.
- Sharpen Your Content Strategy: The data doesn't lie. It shows you which topics, formats, and messages get people talking, so you can stop guessing and start creating more of what works.
- Show the Real ROI: Finally, you can draw a straight line from your social media activity to real business goals, whether that's more website traffic, new leads, or actual sales.
- Build Real Relationships: Engagement is a two-way street. When you foster that dialogue, your audience feels seen and heard, which is the bedrock of brand loyalty and trust.
Think of this guide as your roadmap. We're going to break down the core metrics that tell the complete story of your social media performance, from the first time someone sees your post all the way to the final sale. Once you get a handle on these, you can transform your social media from a chore into a powerful engine for growth.
Decoding the Four Foundational Engagement Metrics
To really get a handle on client engagement, we have to start with the basics. Think of these four metrics as the pillars holding up your entire social media strategy. They go way beyond simple reach, telling you not just how many people saw your content, but how many actually cared enough to do something about it.
This map helps visualize the journey from those flashy vanity numbers, through real, meaningful engagement, and finally to the business value you're actually after.
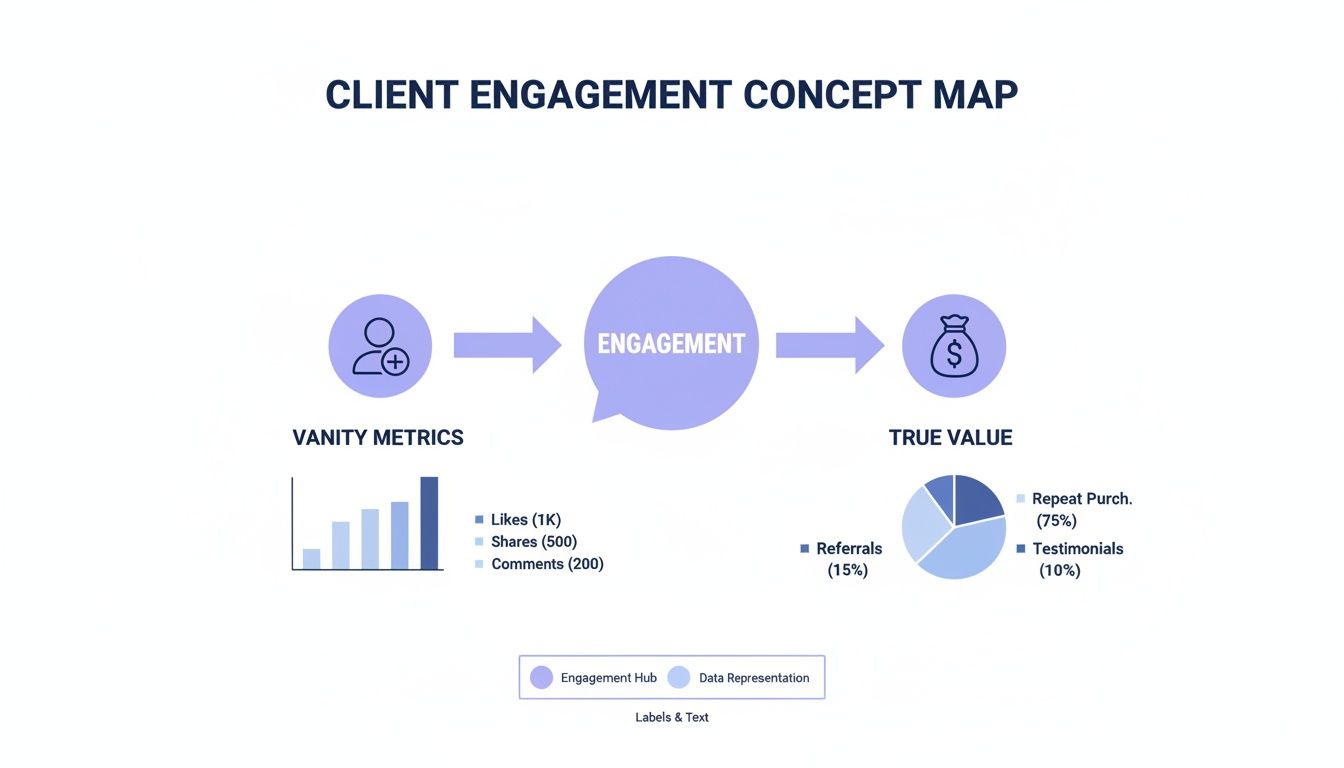
As you can see, engagement is the critical bridge. It's what turns a passive scroller into an active participant, and eventually, a customer. Let's break down the metrics that make this magic happen.
Before we dive deep, here’s a quick snapshot of the core four and what they really tell you.
Core Engagement Metrics At-a-Glance
| Metric | What It Measures | Audience Intent Signal | Platform Spotlight |
|---|---|---|---|
| Engagement Rate | The percentage of your audience that interacted with a post (likes, comments, etc.). | "This content is relevant and interesting to me." | Instagram & LinkedIn |
| Comments | The number of direct replies or thoughts shared on your post. | "I want to join this conversation and share my opinion." | All platforms, especially Facebook & Instagram |
| Shares | The number of times users reposted your content to their own network. | "This is so good, my own followers need to see it." | Facebook, X (Twitter), & LinkedIn |
| Saves | The number of times users bookmarked your post for later viewing. | "This is valuable information I want to come back to." | Instagram & Pinterest |
This table gives you the 30,000-foot view, but the real power comes from understanding the why behind each number.
1. Engagement Rate: The Ultimate Health Check
First up is the big one: Engagement Rate. If you only track one thing, make it this. Think of it as your content's pulse—a direct measure of how much your audience is connecting with what you're putting out there. It’s the percentage of people who saw your post and then liked, commented, shared, or saved it.
A high engagement rate is the clearest sign that your content strategy is working. It shows your community is active, healthy, and genuinely interested. We've seen a massive shift in the industry where engagement has dethroned follower count as the king of KPIs. For instance, Instagram still leads the pack with an average engagement rate of 3.5%, but LinkedIn is right on its heels at 3.4%, proving that engaged communities can be built anywhere.
For a deeper dive into the formulas and strategies, check out our guide on https://postsyncer.com/blog/what-is-engagement-rate.
2. Comments: Where the Conversation Begins
A "like" is a quick, easy nod of approval. A comment? That's a whole different level of commitment. When someone stops scrolling long enough to type out their thoughts, they're investing their time and attention in your brand. It’s the start of a real conversation.
Comments are a goldmine of qualitative feedback. You can quickly gauge:
- Audience Sentiment: Are people excited, confused, or frustrated? The comment section is an unfiltered look into your brand's perception.
- Burning Questions: See the same questions popping up? You’ve just discovered a gap in your messaging or a topic for your next piece of content.
- Community Vibe: By jumping in and replying, you show you're listening. This is how you turn followers into a real community.
A post with 100 likes is nice. A post with 20 thoughtful comments is where you build relationships. Comments are the currency of community.
3. Shares: The Ultimate Form of Social Proof
Shares are the digital equivalent of someone telling their friend, "You have to check this out!" When a user shares your content, they’re putting their own reputation on the line and personally vouching for your brand. It's one of the highest compliments you can receive on social media.
Every share explodes your organic reach, putting your content in front of new, highly-qualified eyeballs. These new audiences are far more likely to trust you because the recommendation came from someone they already know. If you want to explore this concept further, this piece on Understanding Engagement Metrics is a great resource.
4. Saves: The Signal of High-Value Content
Last but not least is the Save—a quiet but incredibly powerful metric. Common on platforms like Instagram and Pinterest, a save is a user's private signal that your content is so good, they need to bookmark it for later.
This is a huge indicator that you're creating genuinely useful, evergreen content. Think recipes, how-to guides, inspiring quotes, or workout routines. A high number of saves means you're not just creating content; you're creating a resource. Because it’s a private action, you know the user is doing it for their own benefit, which is the strongest testament to your content's quality.
Inside PostSyncer’s analytics dashboard, you can track saves to pinpoint which content pillars are providing the most long-term value. This lets you double down on what truly resonates and cut what doesn't.
Tracking the Metrics That Drive Clicks and Conversions
While comments and shares are great for measuring audience appreciation, a different breed of client engagement metrics signals something more powerful: active intent. These are the numbers that connect the dots between social media buzz and real business outcomes, telling you who’s ready to take the next step.
Think of it like running a storefront. Likes and comments are the window shoppers admiring your display. But clicks and conversions? Those are the folks walking through the door, wallet in hand. This is where your social media strategy starts pumping fuel directly into your sales pipeline.
Unpacking Click-Through Rate or CTR
The most direct measure of intent has to be the Click-Through Rate (CTR). It’s a simple but telling metric: what percentage of people who saw your post were compelled enough to actually click the link? It’s the ultimate test of your call-to-action (CTA) and how enticing your offer really is.
A low CTR is a sign that while your content might be interesting, it isn’t creating enough urgency or curiosity. On the flip side, a high CTR tells you your message is hitting the mark and your audience is hungry for more—they want to see that landing page, learn about the product, or grab that download.
Among all the customer engagement metrics out there, CTR has become critical for businesses focused on driving action. It moves beyond passive views to measure genuine interest. When you pair it with metrics like video completion rates, which show if your audience sticks around, you get a much fuller picture of your content’s performance. You can find more insights on the top customer engagement metrics that matter.
Measuring the Power of Video Engagement
Video is king on platforms like Instagram, TikTok, and YouTube Shorts, and you have to look beyond simple view counts to understand its impact. Two metrics are especially revealing here:
- Average Watch Time: This tells you, on average, how long people are sticking around before they swipe away. A longer watch time is a huge signal that your content is captivating.
- Video Completion Rate: This is the percentage of viewers who watch your entire video, from start to finish. A high completion rate is the gold standard, showing your storytelling and pacing were spot-on.
These video-specific metrics are crucial. They don’t just tell the platform algorithms your content is high-quality (which can boost organic reach); they show you that your audience is deeply invested. And an invested audience is far more likely to respond to a CTA later on.
DM Leads and the Rise of Conversational Commerce
Not all engagement happens out in the open. The direct message (DM) inbox has quietly become a powerhouse for lead generation and sales. A simple post that encourages users to "DM us for details" can generate a pipeline of highly qualified leads who are actively looking for answers.
Tracking DM Leads is basically measuring conversational commerce. Each DM is a warm lead—someone who has moved beyond passively scrolling and decided to start a one-on-one conversation. This direct line is invaluable for answering questions, overcoming objections, and personally guiding a potential customer toward making a purchase.
Think of a DM lead as someone raising their hand in a crowded room to ask a specific question. They’ve self-selected as being highly interested, and it's your opportunity to provide a personalized, high-touch experience that a public comment simply can't match.
Inside PostSyncer, you can use campaign labels to track which posts are driving the most DMs. This is a game-changer for identifying which content formats and offers are best at sparking these valuable conversations, letting you double down on what works.
Conversion Metrics: The Ultimate Proof of ROI
At the end of the day, the goal of most social media activity is to drive a specific action that benefits the business. This is where conversion metrics come into play. A conversion is any desired action a user takes after clicking a link in your social post.
Conversions can be whatever you define as valuable:
- Making a purchase on your e-commerce store
- Signing up for your newsletter
- Downloading a free guide or e-book
- Booking a consultation or demo
- Filling out a contact form
To track these actions accurately, you need to connect the click on social media to the final conversion on your website. This is where UTM parameters become your best friend. A UTM (Urchin Tracking Module) is just a simple piece of code added to the end of a URL to track the source, medium, and campaign name tied to that click.
For example, a UTM-tagged link can tell you a specific sale came directly from your "Summer Sale" post on Instagram, not from a Google search or an email campaign. This level of detail is critical for proving social media's return on investment (ROI) and making smart decisions about where to put your time and money. By tracking these bottom-of-the-funnel metrics, you can finally show exactly how your social media efforts translate into real, tangible business growth.
Connecting Social Engagement to Real Business Growth
Likes and shares are great for the ego, but they don't pay the bills. If you want to get real buy-in from leadership and prove your team's value, you have to start speaking their language. That means connecting all that social media activity to the one thing that really matters: business growth.
This is where we bridge the gap between audience applause and bottom-line results. We're going to dive into the metrics that the C-suite actually cares about, starting with the big one that ties everything together: the Conversion Rate.
From Engagement to Action with Conversion Rate
Ultimately, the goal of almost any social media strategy is to get people to do something. The Conversion Rate is your scoreboard for how well you're making that happen. It's the percentage of people who actually follow through on a desired action after clicking a link in one of your posts.
This is the metric that turns social media from a "nice-to-have" brand-building channel into a predictable revenue engine. It directly links a comment or a share to a sale or a new lead, making it the most powerful (and admittedly, most complex) metric you can track. It’s the key to justifying your budget and proving your impact.
Measuring Customer Lifetime Value and Retention
While a conversion captures a single win, the real magic of social engagement is in building relationships that last. That’s where Customer Lifetime Value (CLV) enters the picture. CLV is a prediction of the total profit your business can expect to make from a single customer throughout your entire relationship.
Think about it: consistent, positive interactions on social media keep your brand top-of-mind and build a genuine sense of community. This isn't just about making a sale; it's about making customers feel valued long after they've clicked "buy." A high CLV is the hallmark of a healthy, sustainable business built on a foundation of loyal fans, not just one-off purchasers.
A business focused solely on new customer acquisition is like a bucket with a hole in it. A business focused on retention and CLV is building a loyal army of repeat buyers who actively contribute to long-term growth.
Hand-in-hand with CLV is your Customer Retention Rate—the percentage of existing customers you manage to keep over a certain period. Every comment you reply to, every DM you answer, and every conversation you nurture directly feeds this number. The impact is staggering: a mere 5% increase in customer retention can boost profitability by 25% to 95%. That's proof that keeping your current customers happy is one of the smartest, most cost-effective growth strategies out there.
Reporting on What Truly Matters
To really connect the dots for the higher-ups, you have to become fluent in the key performance marketing metrics that executives live and breathe. When you build your reports, frame your social data in these business-centric terms.
Instead of just celebrating a higher engagement rate, show what that engagement produced. Show how the posts with the most buzz also generated leads that were more likely to convert.
- Don't just say: "Our engagement rate increased by 15% this quarter."
- Instead, say: "By boosting engagement 15%, we drove a 10% lift in qualified leads from our social channels, contributing directly to the sales pipeline."
This shift in framing is everything. It moves your work from being seen as a "cost center" to a "revenue driver." You’re showing that every engaging post is an investment in building a more profitable, resilient business. If you want to learn more about connecting these dots, you might like our deep dive on how to measure social media ROI.
By tracking and reporting on these advanced metrics, you're providing undeniable proof of your strategy's value. You’re not just managing a social media account; you are actively building and nurturing a core business asset that delivers a measurable return. This is how you secure bigger budgets, earn trust, and solidify your role as a key player in the company's success.
Building a Client-Ready Engagement Dashboard
Let’s be real: raw data is just noise. A spreadsheet full of numbers won't impress anyone. But a well-designed dashboard? That transforms the noise into a clear story of success.
Building a dashboard for a client isn't about cramming every metric you can find onto one screen. It’s about being selective and telling a visual story. You’re turning complex client engagement metrics into a narrative that makes perfect sense, even to someone who doesn't live and breathe social media analytics. This dashboard becomes the centerpiece of your communication, answering the client’s biggest question: "So, is this social media thing actually working?"

Prioritizing Metrics Based on Goals
The metrics you highlight must directly tie back to the campaign's main goal. A one-size-fits-all dashboard just creates confusion. Instead, you need to tailor it to showcase the key performance indicators (KPIs) that prove you're hitting the targets that matter to their business.
For instance, your dashboard’s focus will shift completely depending on why you're running the campaign.
Brand Awareness Campaigns: Here, the story is all about reach and resonance. You want to show how many new eyeballs saw the content and what the reaction was.
- Primary Metrics: Engagement Rate, Shares, Impressions, and Follower Growth.
- Supporting Metrics: Comments and Average Watch Time on video content.
Lead Generation Campaigns: Now, the narrative flips to action and intent. The goal is to prove how your social media activity is filling their sales pipeline.
- Primary Metrics: Click-Through Rate (CTR), DM Leads, and Conversion Rate (like email sign-ups).
- Supporting Metrics: Saves on high-value posts and the cost per lead.
When you align metrics to goals like this, you create instant clarity. The client can see at a glance whether the strategy is delivering on its promise, making your reports incredibly powerful.
Visualizing Progress and Telling a Story
How you present the data is just as important as the data itself. Smart visualization turns a boring spreadsheet into a compelling narrative that highlights progress and gives much-needed context. A great dashboard doesn't just show numbers; it explains what they mean.
Your dashboard should tell a story of "before and after" or "cause and effect." A simple line graph showing a spike in website traffic right after a high-engagement post instantly connects your social activity to a real business result.
Here are a few must-have elements for a powerful dashboard:
- Trend Lines Over Time: Always use line charts to show how metrics perform month-over-month. This is the best way to demonstrate growth and spot any seasonal trends.
- Goal vs. Actual Benchmarks: Set clear, realistic benchmarks for your main KPIs. A simple bar chart comparing your actual performance against that goal gives instant context on how you're tracking.
- Top-Performing Content: Make sure to include a section that showcases the posts with the highest engagement, clicks, or conversions. This answers the "what's working?" question and gives you a clear direction for future content.
- Key Takeaways Section: Never assume the client will interpret the charts the way you do. Add a small text box with 2-3 bullet points summarizing the key insights, wins, and your plan for the next month.
Tools like PostSyncer make this a whole lot easier by pulling all this data into one place, so you can build these reports without the headache. For a deeper dive into creating these visual tools, check out our guide to building effective social media analytics dashboards. Ultimately, an effective dashboard is your best tool for proving your value and building rock-solid client trust.
Common Engagement Tracking Mistakes and How to Avoid Them
Even the most buttoned-up social media strategy can unravel if you’re making simple reporting mistakes. Tracking your client engagement metrics is obviously vital, but it’s shockingly easy to get lost in the numbers and start chasing the wrong things. Let's break down the common pitfalls that can totally undermine your data's value.
The biggest and most common trap? Celebrating vanity metrics. A sudden spike in followers feels great, like a real win, but if it doesn't bring any new likes, comments, or clicks along with it, it’s just an empty number. It’s like throwing a huge party where tons of people show up, but they all just stand in a corner and don't talk to anyone. It looks impressive on the surface, but no real connections are happening.

Ignoring Context and Consistency
Another classic mistake is trying to apply a one-size-fits-all approach to your metrics. A killer engagement rate on LinkedIn is a completely different beast than a great one on TikTok. Each platform has its own vibe, its own user behaviors, and its own benchmarks. Ignoring that context will only lead to flawed comparisons and unrealistic goals.
Just as damaging is tracking your numbers inconsistently. If you measure engagement one week but then get busy and skip the next, you're creating massive data gaps. Good luck spotting trends or understanding what’s really happening over time. This sloppiness often extends to forgetting UTM parameters—those little tags that are absolutely essential for tracing where your conversions came from. Without them, you're just flying blind, completely unable to prove which of your social efforts are actually delivering the goods.
The real tragedy, though, is collecting all this data and then doing nothing with it. Data is useless if it just sits in a dashboard collecting digital dust. The whole point is to turn those numbers into a story that tells you exactly what to do next.
Actionable Solutions to Common Pitfalls
To make sure your metrics are always telling you something useful, you need a proactive game plan. Here are a few practical ways to keep your tracking sharp and your strategy on point:
- Focus on Ratios, Not Raw Numbers: Instead of just getting excited about 1,000 new followers, dig deeper. What's the engagement rate of those new followers? This gives you context and tells you about the quality of your audience growth, not just the quantity.
- Establish Platform-Specific Benchmarks: Set different goals for each social network. Base them on industry averages and, more importantly, your own past performance. This allows for a much fairer and more accurate way to judge your strategy’s success.
- Automate Your Reporting: This is a no-brainer. Use a tool like PostSyncer to pull your data automatically. It guarantees consistency and frees you up to spend your brainpower on analysis and strategy instead of tedious copy-pasting.
- Create an "Insights to Action" Workflow: Make it a rule. For every single report you create, include a section outlining the key takeaways and the specific actions you’re going to take based on what you learned. This closes the loop between measuring something and actually improving it.
Frequently Asked Questions About Engagement Metrics
Jumping into client engagement metrics always sparks a few questions. I've been there. To help you out, I've put together some quick, straightforward answers to the most common challenges you'll face when you start tracking these numbers.
What Is a Good Engagement Rate?
This is the million-dollar question, isn't it? The honest answer is: there's no magic number. A "good" rate is completely relative to the platform and industry you're in.
For instance, a 2% engagement rate might be fantastic on Facebook, but on Instagram, top brands are often pushing for 3-5%. The best way to measure success is to stop worrying about a universal average and start benchmarking against your own past performance and your closest competitors.
The real goal is consistent, month-over-month improvement. A steadily climbing rate is the clearest sign that your content strategy is hitting the mark and resonating more deeply over time.
How Often Should I Report on These Metrics?
Your reporting schedule really boils down to your client's needs and your campaign goals, but a monthly report is a great place to start. It gives you enough data to identify real trends without getting lost in the noise of daily ups and downs.
Of course, if you're in the middle of a big campaign or a product launch, weekly check-ins are invaluable. They let you make smart, quick pivots based on what the data is telling you right now.
The key isn't just how often you report, but what you do with the information. Each report should lead to actionable insights that inform your strategy for the next period, turning data collection into a proactive growth tool.
Which Metrics Are Most Important for Proving ROI?
While every metric tells part of the story, some are just plain better at connecting the dots back to the bottom line. When you need to prove your return on investment (ROI), these are the three metrics that carry the most weight.
- Conversion Rate: This is the big one. It directly links your social media activity to tangible business results like sales, sign-ups, or leads.
- Click-Through Rate (CTR): This shows how good you are at getting people off the social platform and onto the web pages that matter, like a product page or blog post.
- Customer Lifetime Value (CLV): For a more long-term perspective, CLV shows how your engagement efforts are building loyalty and increasing the total financial value of each customer over time.
Ready to stop juggling spreadsheets and start telling a clear story of success? PostSyncer pulls all your client engagement metrics into one simple dashboard. You can finally track what matters, build client-ready reports in minutes, and prove your ROI without the headache. Start your free 7-day trial today and see the difference.