


DataReportal counted 5.24 billion active social media user identities worldwide in early 2025, and the average user engaged with 6.83 platforms monthly. That scale makes social media analytics less about finding one winning number and more about understanding what people do across networks, content and stages of a customer journey, as DataReportal's Digital 2025 overview shows.
Good analysis moves from what happened to what you should do next. A post can reach many people without prompting action, or reach fewer people but lead to meaningful interest. The aim is to treat metrics as strong evidence for a decision, not a complete record of every person or influence.
The Core Metrics and What Each One Tells You
Use this table as a reference when you review a post or campaign. The formulas are simple, but each metric answers a different question, and none can tell the whole story on its own.
| Metric | Formula or basis | What it signals | Limit |
|---|---|---|---|
| Impressions | Total times content was displayed | Exposure volume | Counts repeat views, not people |
| Reach | Unique accounts that saw the content | Breadth of distribution | Definitions differ by platform |
| Engagement rate by impressions | Interactions ÷ impressions | Response per view | The denominator can vary by network |
| Engagement rate by reach | Interactions ÷ reach | Response per person exposed | Requires platform reach data |
| Click-through rate | Link clicks ÷ impressions | Interest in the next step | Doesn't show whether a click led to a purchase |
| Video completion rate | Viewers who finished ÷ video starts | How well the opening and full edit held attention | Platforms can define a start differently |
| Saves and shares | Count per post | Whether content is worth revisiting or passing on | Giveaways can inflate both |
| Follower growth | Net follower change over a period | Audience accumulation | Can lag behind content and be affected by paid follows |
| Conversions | Tracked actions after a click, such as sign-ups or purchases | Business outcome | Tracking must be set up for the action to be visible |
Think of the rows as three tiers. Exposure metrics, such as impressions and reach, show how much distribution a post received. Response metrics, including engagement, saves and shares, help reveal whether people reacted to it. Action metrics, such as clicks and conversions, show whether someone took a next step.
These tiers are useful together because a strong result at one stage doesn't guarantee a strong result at the next. High reach with few interactions may point to a weak match between the post and its audience. A post with less reach but meaningful saves or conversions may be a better candidate to adapt or promote. Platform audiences and reporting definitions differ, so keep each metric's definition with the result rather than assuming every network counts it the same way.
Start small: Choose one metric from each tier, write down its definition and keep that definition fixed when you compare results over time.
Raw Counts Versus Normalized Rates
Post A earns 4,000 interactions from 400,000 people reached, for an engagement rate by reach of 1.0%. Post B earns 900 interactions from 12,000 people reached, for a rate of 7.5%. Post A has more interactions, but Post B engaged a much larger share of the people it reached.
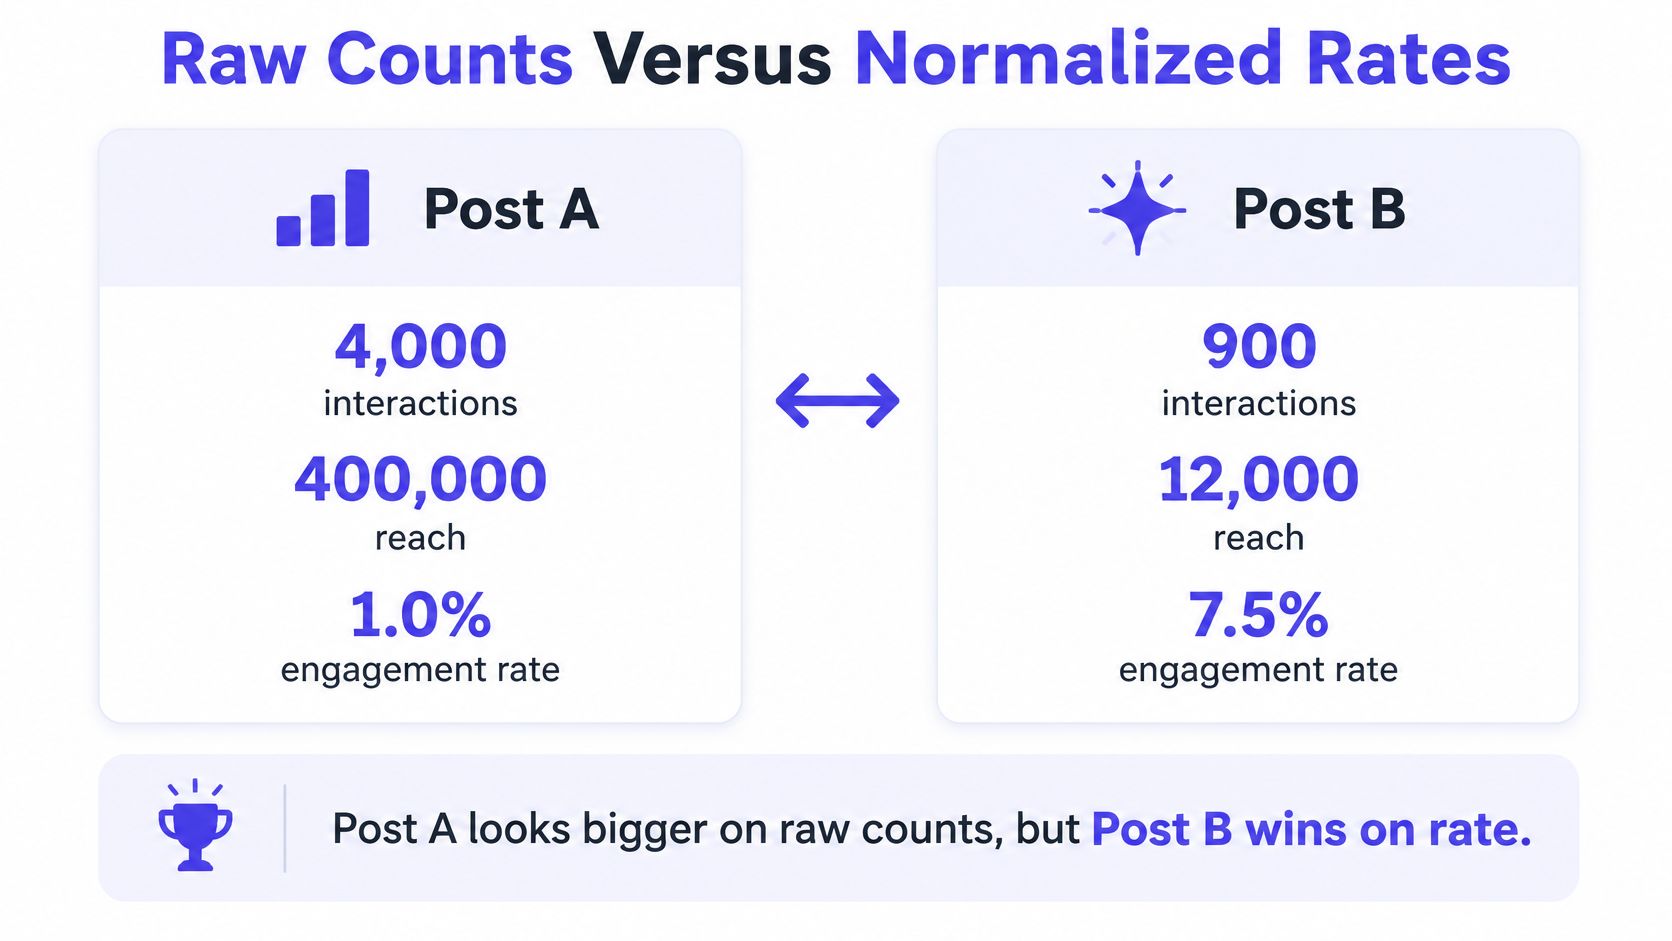
That difference explains why raw counts and normalized rates belong side by side. Raw totals naturally favor accounts with larger audiences and posts that receive wider distribution. A normalized rate relates actions to exposure or audience size, which can make it easier to judge how efficiently a post prompted a response. A research synthesis on social media engagement measurement distinguishes raw measures from normalized indexes and describes engagement rates based on interactions divided by impressions or reach.
Check the denominator before comparing
“Engagement rate” isn't a complete definition by itself. One platform may divide interactions by impressions, another by reach, and a third may use followers or a different base. Those percentages can look alike while measuring different things. Don't rank them across networks until you've confirmed that their definitions match.
For each post, record both parts of the calculation: the interaction count and the denominator used. Store the platform, post format, audience and publication period too. This makes later comparisons easier to interpret and helps catch changes in the platform's reporting or your own measurement setup.
Use an exposure-normalized rate to assess how a creative performed, then look at profile visits, link clicks, leads or purchases to see whether attention led to useful action. If you need a clearer definition of the calculation, this guide to engagement rate can help you check what a rate includes.
For a practical check, calculate engagement by reach for your last ten posts, then sort them once by raw interactions and once by rate. Compare each result with posts from the same network and format in your own history. The ranking may change, but neither ranking alone decides what to publish next. Use the rate to assess response efficiency and downstream actions to assess value.
Platform Analytics Compared by Network
Pew Research Center's 2024 survey found that 83% of U.S. adults had ever used YouTube, 68% Facebook and 47% Instagram. TikTok, LinkedIn, Pinterest, WhatsApp and Snapchat each fell between 27% and 35% in that survey, a reminder that a brand's audience and goals can differ from network to network, according to Pew Research Center's social media use report.
| Platform | Native metrics | Best used to judge | Watch out for |
|---|---|---|---|
| Reach, impressions, saves, shares, profile visits, follows | Discovery and saves on Reels and carousels | Match date ranges because reach and impressions are separate | |
| Reach, post engagement, link clicks, video views | Page distribution and link traffic | Organic and paid reach are reported separately | |
| Impressions, clicks, reactions, comments, follower demographics | Professional audience fit and company page growth | Impressions and unique impressions aren't the same | |
| X (Twitter) | Impressions, engagements, engagement rate, profile visits, link clicks | Reach around live conversations | Engagement counts differ by post type |
| TikTok | Video views, average watch time, completion rate, traffic source | Hook quality and retention | Read views alongside watch time because views count early starts |
| YouTube | Views, watch time, average view duration, thumbnail click-through rate | Title and thumbnail performance, plus retention | Views and watch time may use different timelines |
| Impressions, saves, outbound clicks | Long-tail discovery and traffic | Saves can continue to generate activity after publication |
Each row helps answer a different operational question. Instagram saves can signal that a carousel is useful enough to revisit. YouTube watch time can help you assess whether a video held attention beyond its title and thumbnail. Pinterest outbound clicks can indicate whether a pin sent people to a site, while follower counts alone won't tell you that.
Native analytics are useful for decisions within one network, but they don't automatically provide a consolidated view of all accounts. A cross-platform tool can bring connected accounts together; PostSyncer's real-time analytics show performance across connected platforms. Consolidation saves switching between dashboards, but it doesn't make the platforms' underlying definitions identical.
Compare a metric within the same platform and period unless you've confirmed that its definition is identical elsewhere. Before judging results, assign each network a role, such as discovery, community, consideration, customer service or conversion.
How to Test Posting Times With an Experiment
A dashboard may show that posts published at 7 p.m. had higher reach, but that's a correlation, not proof that the hour caused the difference. The evening posts might also have featured a stronger topic, a different format, a better-matched audience or paid promotion. A peer-reviewed Facebook publishing study treats posting time as a causal question and estimates expected reach while accounting for other factors that can influence performance.
Define the question and outcome. Ask whether posting time changes reach, and use reach as the primary outcome. Track clicks, saves and comments as secondary outcomes so a wider audience doesn't hide weaker response.
Record the other factors. For every post, log the platform, format, topic, weekday, audience timezone, account and paid status. These details help distinguish an hour effect from a change in what you published or who saw it.
Schedule comparable posts in candidate slots. Alternate similar topics and formats across the time slots you want to compare over four to six weeks. Matching the content as closely as practical makes the timing comparison more informative.
Estimate expected reach for each slot. Start with a stratified comparison, which means comparing posts within similar groups, or use a regression model to account for the recorded factors. Don't treat a simple overall average as a clean test if the posts differ substantially.
Check the result with a holdout or staggered test. Randomly hold back some posts from the new recommendation, or stagger the test across accounts. This helps reveal whether one unusual period or account drove the apparent improvement.
Keep the slot only if the result holds. Act when the reach gain repeats in at least two of three test windows and clicks, saves and comments hold steady or rise. If the secondary outcomes fall, wider distribution may not be helping your actual goal.
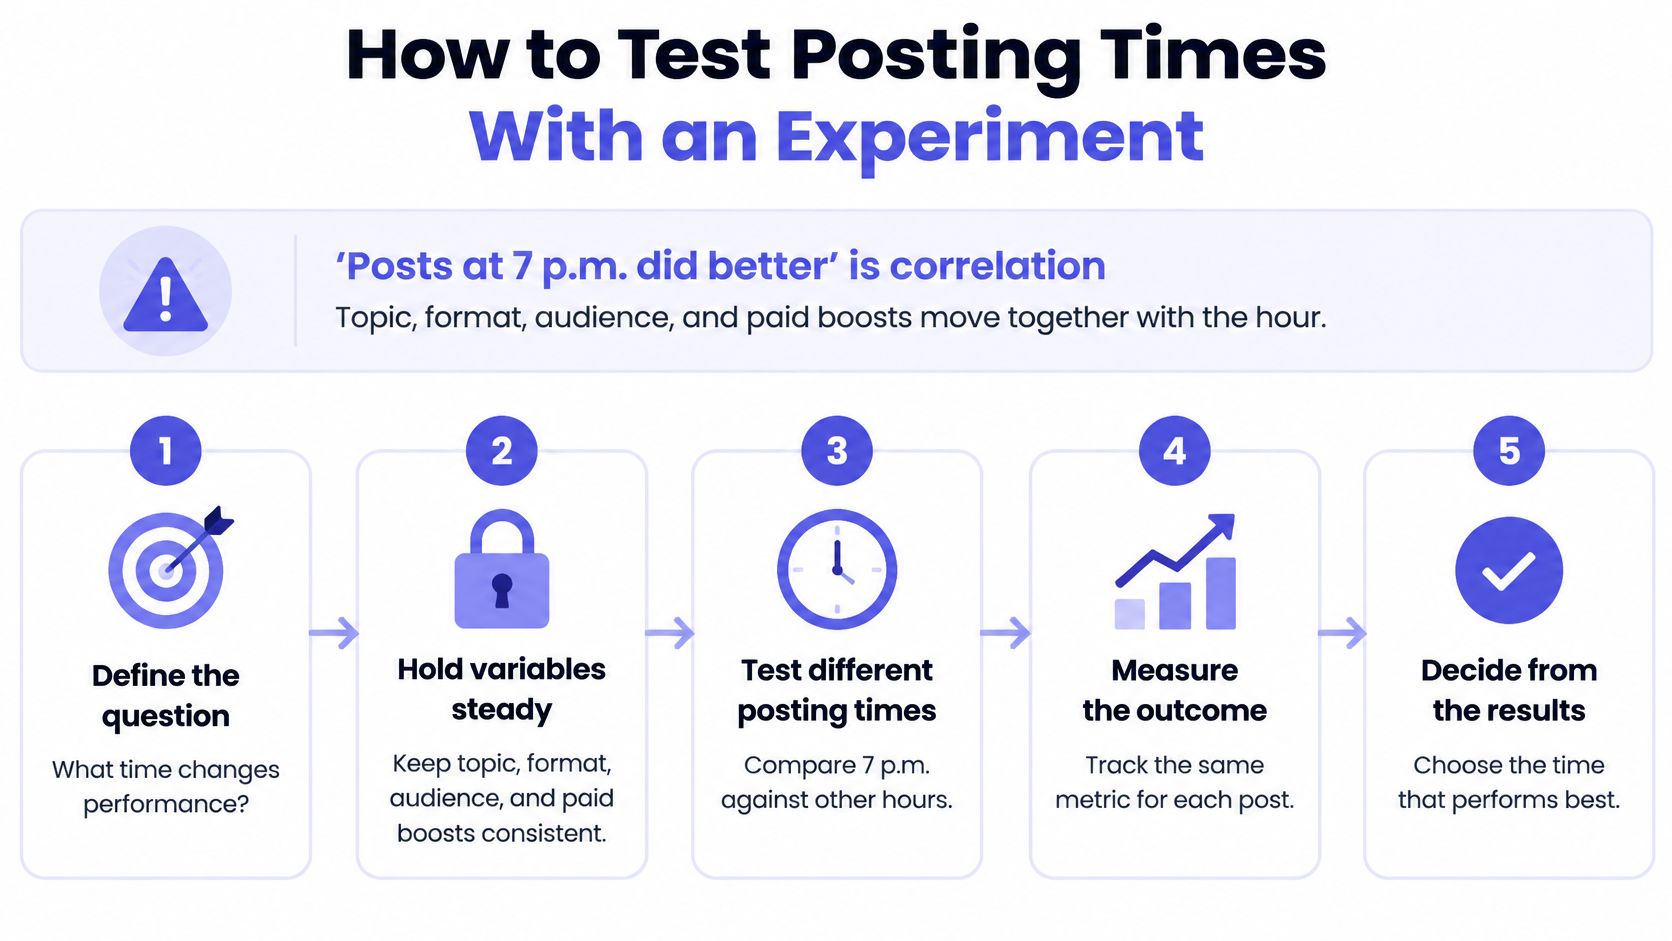
Keep a record of the candidate slots, what you held constant and the results. If scheduling is part of the test, this guide to scheduling optimization offers a useful starting point for planning posts around a consistent process.
Attribution From Clicks to Revenue
A 2025 survey of 1,200 marketing leaders found that 56% believed social media drives revenue, while 44% rated their social teams as expert at measuring business impact. Engagement was the most common ROI measure, used by 68%, compared with 57% who used revenue, according to the survey summarized by NetInfluencer on the social media measurement gap. The gap matters because a post can attract attention without proving it generated an additional sale.
Last-click attribution credits the final recorded click before a conversion. That can make social's role look smaller when a person first discovers a brand in a post, then returns later through a search, an email or a direct visit. Conversely, a platform's ability to claim credit for a conversion doesn't by itself prove the channel caused an additional purchase. For a useful explanation of the difference, see marketing attribution versus incrementality.

Choose the method that fits the question
A sensible measurement hierarchy starts with operational metrics to diagnose the content, moves to outcome metrics to track business results, and uses experiments to estimate whether social caused extra results.
| Method | Best for | Main limit | Effort |
|---|---|---|---|
| UTM-tagged links | Connecting clicks to sessions and sales | Misses posts without links and private messages | Low |
| Promo or referral codes | Tracking offer-driven sales | Customers who skip the code go uncounted | Low |
| CRM source field, such as “How did you hear about us?” | Understanding lead and customer origin | Answers need to be honest and consistent | Medium |
| Cohort comparison | Reviewing retention and repeat purchase | Other activity may explain the difference | Medium |
| Geo or audience holdout test | Estimating causal lift from social | Requires a region or audience to be withheld | High |
| Incrementality test | Estimating added sales | Needs enough volume for a reliable result | High |
UTM tags attach campaign details to a link so website analytics can group the visits it receives. This guide to Google Analytics UTM parameters can help you use consistent names. A CRM source field or referral code can add context when a lead or customer can't be confidently matched to a tracked click.
A holdout test addresses the central causal question: would these sales have happened anyway? Compare a group exposed to the campaign with a similar group that wasn't, while keeping other differences as controlled as possible. For a small business, a practical first step this quarter is to tag social links consistently, then test one campaign with a modest audience or regional holdout if the business can do so without disrupting service.
When Dashboards Disagree With Your Other Numbers
A drop in tracked conversions doesn't always mean a post stopped working. A link may have lost its tracking tags, or people may have reached the site through a private message, a community recommendation or another path that analytics classified as direct. A 2025 B2B social media report found that 56% cited content-marketing ROI attribution as a top challenge, while 57% reported difficulty tracking customers across the journey.
| Mismatch | Likely cause | Check or fix |
|---|---|---|
| Platform clicks exceed web sessions | Link shorteners, in-app browsers or bot filtering | Compare the same UTM link in both tools over the same date window |
| Conversions fall while engagement holds | Tracking broke or traffic is arriving untagged | Audit UTMs and the conversion tag, then check direct traffic |
| CRM shows more leads than social reports | Private messages or other dark social paths | Add a “How did you hear about us?” field to forms |
| Conversion rate looks unusually high | Platform reports view-based or self-attributed conversions | Compare with web analytics using the same attribution window |
| Follower counts differ between tools | Sync timing or inactive and deleted accounts | Use the platform's own count for trends and note the source |
Resolve mismatches by aligning metric definitions and date windows first. Then document what the systems can't capture, and compare platform analytics with web analytics, CRM records and qualitative comments. A customer's answer about how they heard of you can add context, even if it doesn't identify a precise post or moment.
Privacy rules and platform controls also limit what can be tracked or connected. Where lawful and appropriate, first-party or server-side data may help with measurement, but it still won't reveal every private conversation or offline influence. Report estimates with a range or confidence level when the underlying evidence is incomplete, rather than presenting an exact-looking number as certainty.
Run Your First Monthly Analytics Review
A useful monthly review should end with one test to run, not just a report to file. Start by choosing the same date range for each network, then work through the results in a fixed order.
Pull the core metrics. Gather exposure, response and action measures for every platform over the same period. Keep the original platform definitions beside the numbers.
Compare reach-normalized engagement. Calculate interactions divided by reach for each post, then group results by format. This gives you a way to spot formats that prompted a stronger response among the people they reached.
Inspect the strongest and weakest posts. List the top five and bottom five, then note shared features such as format, topic and time slot. A repeated pattern is a useful hypothesis, not proof that one feature caused the result.
Check business outcomes. Compare tracked conversions with UTM links and CRM source fields. If the records don't line up, use the mismatch checks to investigate before concluding that the content failed.
Choose one test for next month. Say a carousel has 2.1% reach-normalized engagement while a video has 0.9%, but the carousel produces fewer link clicks. The carousel is the stronger creative for response, yet the next test could change its link placement rather than abandoning the format.
Record the decision and confidence. Write down what you'll change, which definitions you used and how certain you are. If your team uses AI to draft or repurpose content, starryai's guide to social media AI can help you think through where AI tools fit into the content workflow without confusing production speed with performance.
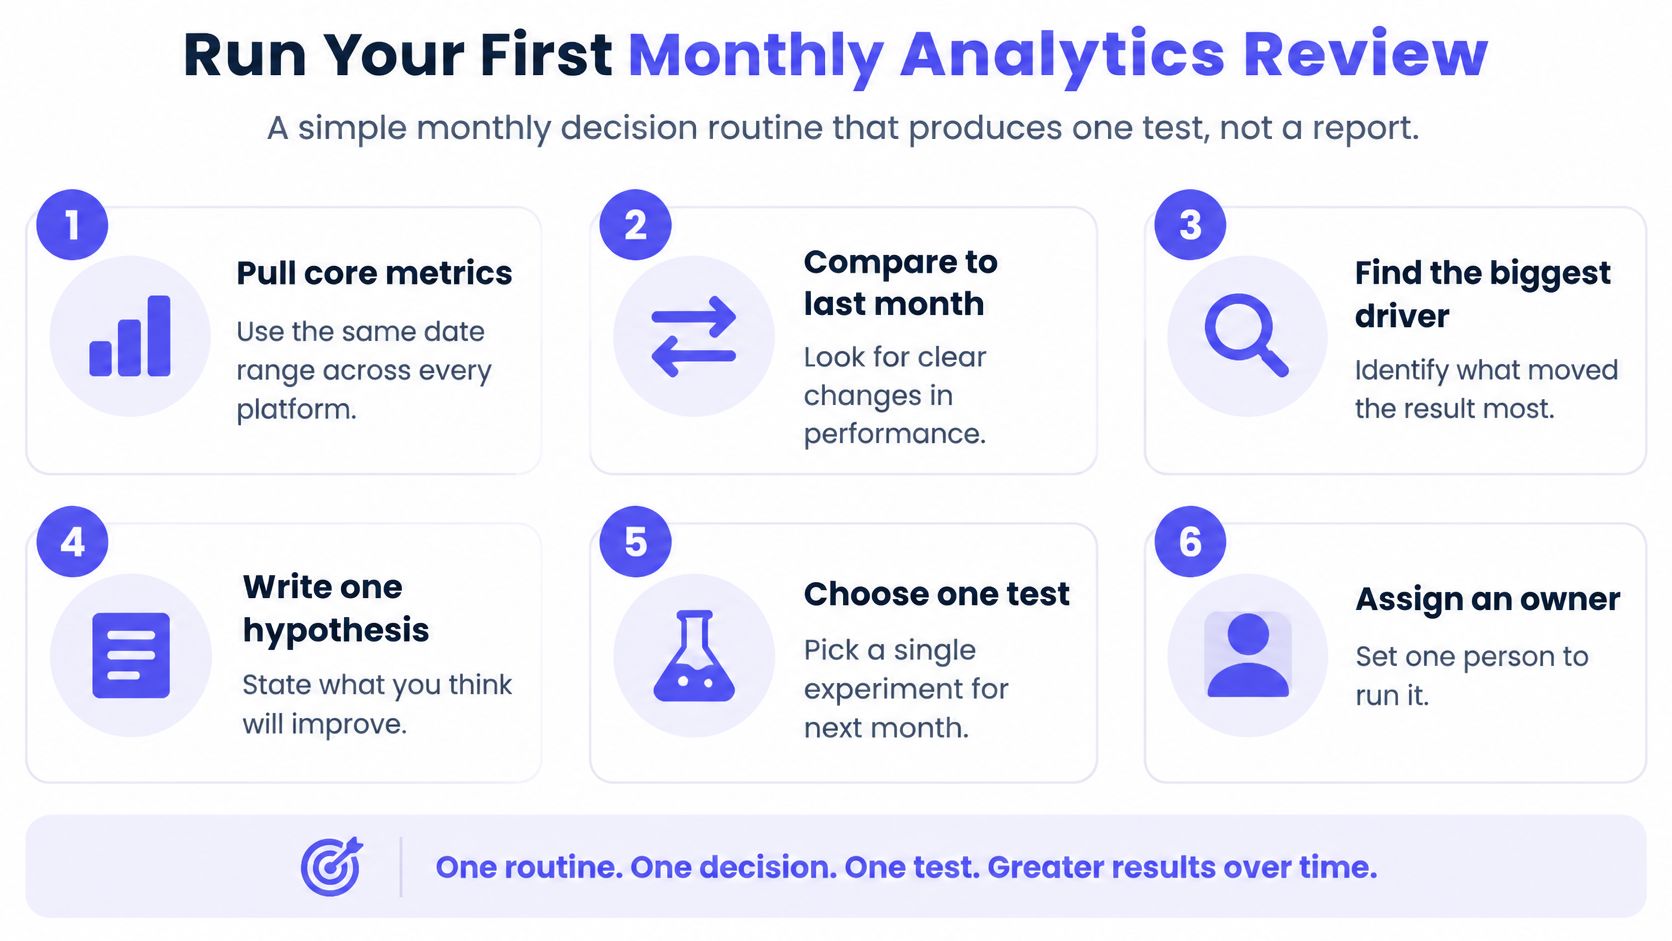
This routine works best when someone owns the next test and checks the result in the following review. A shared workspace can make it easier to keep the schedule, content and performance notes together. This week, choose three core metrics, write down their definitions, and only then pull the data.
PostSyncer lets you schedule and publish content across multiple social platforms, manage accounts with your team, and analyze social performance and engagement in one place. Start a free trial to connect your accounts and turn your next analytics review into a practical content test with PostSyncer.