


Social media analytics and reporting is all about digging into the data from your social platforms and making sense of it. It’s how you stop guessing what your audience wants and start knowing what actually drives results—like sales, leads, and genuine brand loyalty. A data-first approach isn't just a nice-to-have anymore; it's a core part of any smart marketing strategy.
Why Data-Driven Social Media Is No Longer Optional
The "post and pray" era of social media is officially over. Just throwing content out there without measuring its impact is like driving blind—you're moving, sure, but you have no clue if you're getting any closer to your destination. A solid analytics and reporting strategy is the compass that guides every move you make, turning what can feel like a cost center into a predictable engine for business growth.
I’ve seen it firsthand: the brands that win aren't just posting—they're constantly listening, measuring, and adjusting. They use analytics to understand what customers are saying, keep an eye on what competitors are doing, and sharpen their messaging in real-time. This goes way beyond just chasing likes or follower counts. It’s about connecting the dots between your social activity and real, tangible business goals.
When you can translate raw numbers into smart decisions, you can finally draw a straight line from your social media efforts to increased revenue, better campaign results, and a stronger brand. That's the difference between being busy and being effective.
The Financial Proof Behind the Push
Don't just take my word for it—look at where the money is going. The business world is pouring resources into social media analytics, and that tells you everything you need to know about its importance.
The global social media analytics market is growing at a staggering pace. Forecasts show it jumping from around $13.83 billion to $17.39 billion in just a single year. Projections even suggest it could skyrocket to over $51.25 billion soon, all thanks to the explosion of user-generated content and the need to integrate it into marketing. You can read more about this explosive market growth and what’s driving it.
Seeing that level of investment makes one thing crystal clear: getting good at social media analytics isn’t just some niche skill anymore. It’s a fundamental business requirement.
Before we dive deeper, it helps to have a firm grasp of the basic building blocks. These are the core ideas that every great social media report is built on.
Core Social Media Analytics Concepts at a Glance
| Concept | What It Is | Why It Matters |
|---|---|---|
| KPIs (Key Performance Indicators) | Specific, measurable metrics (e.g., conversion rate, engagement rate) you track to see if you're hitting your goals. | They turn vague objectives like "increase brand awareness" into concrete, trackable targets. |
| Metrics | The raw data points you collect, like likes, shares, comments, reach, and clicks. | Metrics are the ingredients. You need them to calculate your KPIs and understand performance at a granular level. |
| ROI (Return on Investment) | A calculation that measures the financial return you get from the money and time you put into your social media efforts. | This is the ultimate proof of value. It shows executives and stakeholders that social media is a revenue driver, not just an expense. |
| Attribution | The process of identifying which social media touchpoints led a customer to take a desired action (like making a purchase). | It helps you understand which channels and campaigns are most effective at converting, so you can double down on what works. |
Understanding these concepts is the first step toward building a strategy that doesn't just look good on paper but actually delivers measurable results.
From Vague Metrics to Tangible ROI
So, how does all this theory actually help your business day-to-day? The real power of social media analytics is that it brings clarity and confidence to your decisions. You can stop operating on gut feelings and start making strategic moves backed by solid evidence.
A great analytics framework will help you:
- Spot Your Winning Content: Pinpoint the exact posts, formats (video, carousel, text), and topics that your audience loves, so you can stop guessing and create more of what works.
- Optimize Your Ad Spend: Figure out which campaigns and platforms are giving you the best bang for your buck, allowing you to cut wasteful spending and reallocate your budget for maximum impact.
- Truly Understand Your Audience: Learn when your followers are online, what devices they're using, and what kind of content actually makes them stop scrolling and take action.
- Refine Your Brand Voice: Keep a pulse on customer sentiment to see how your brand is perceived. This allows you to tweak your tone and messaging to build a stronger connection.
Ultimately, committing to social media analytics gives you the power to prove your worth. It provides the hard data you need to justify your budget, get buy-in for new ideas, and build a social media presence that everyone can see is contributing directly to the bottom line.
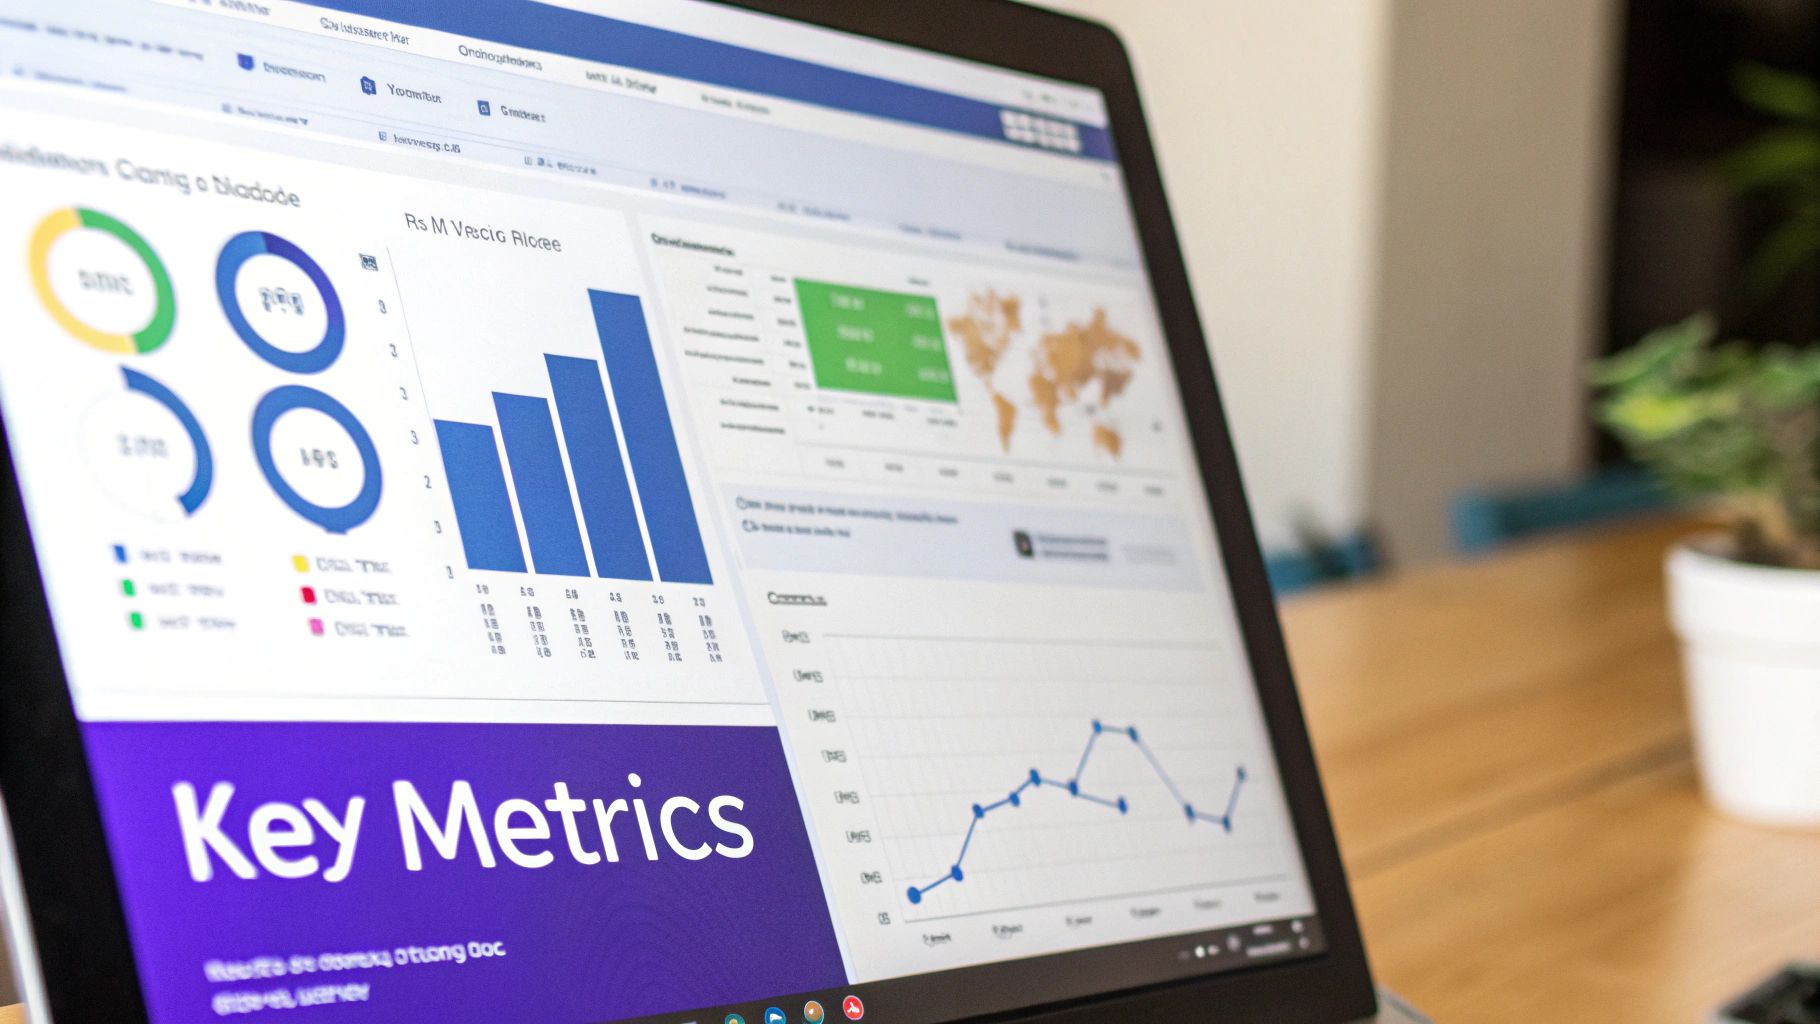
Choosing KPIs That Actually Drive Business Goals
It's one of the biggest traps in social media analytics: getting obsessed with vanity metrics. We've all been there. Seeing a growing follower count or a wave of likes feels fantastic, but let's be real—those numbers don't pay the bills.
Real success is measured by how your social efforts move the needle on actual business objectives, whether that's generating qualified leads, making customers more loyal, or driving sales.
Effective social media reporting starts by defining Key Performance Indicators (KPIs) that tie directly back to those goals. This is your framework for measurement, the system that helps you cut through the noise and focus on what truly matters. Without it, you're just collecting numbers without a purpose.
A KPI isn't just a metric; it's a metric with a mission. For instance, "website clicks" is a metric. But if your goal is lead generation, then "conversion rate from social traffic" is your KPI. It tells a much richer story—not just how many people clicked, but how many took the exact action you needed them to.
Aligning KPIs With Business Objectives
The very first thing you need to do is connect your big-picture business goals to social media KPIs you can actually track. The link has to be direct and make sense. If your main goal is to boost brand awareness, then chasing website conversions is probably the wrong move. You'd want to prioritize metrics that show you're getting seen and remembered.
Here’s a quick look at how you can map common business goals to the right KPIs:
Goal: Increase Brand Awareness. You want to get in front of new people and become a familiar name. Your KPIs should reflect that visibility.
- Reach: The total number of unique people who saw your content.
- Impressions: The total number of times your content was shown.
- Share of Voice: How your brand's mentions stack up against your competitors.
Goal: Drive Website Traffic. The idea here is to pull users from social media over to your website, blog, or a specific landing page.
- Click-Through Rate (CTR): The percentage of people who saw your post and clicked a link in it.
- Cost Per Click (CPC): Absolutely essential for paid campaigns to see how efficient your ad spend is.
- Traffic from Social Referrals: A metric you’ll find in your website analytics, like Google Analytics.
Goal: Generate New Leads. This is all about capturing contact info from potential customers.
- Conversion Rate: The percentage of users who filled out a lead form after coming from social.
- Cost Per Lead (CPL): How much it costs you, on average, to get one lead from your social channels.
Key Takeaway: The KPIs you pick for a new product launch (focused on awareness and reach) will be completely different from those for an end-of-quarter sales push (focused on conversion rate and ROI).
Platform-Specific and Campaign-Specific KPIs
What works on LinkedIn will almost certainly flop on TikTok. You can’t use a one-size-fits-all approach. Each platform has its own audience and content style, so your KPIs have to adapt.
For a professional network like LinkedIn, metrics like profile views or engagement on long-form articles could be gold for a B2B thought leadership campaign.
Switch over to a visual-first platform like Instagram, and you might focus more on Reel saves or story replies to see what's truly resonating with your audience. If your brand uses X (formerly Twitter) for customer service, then response time and customer sentiment score are the KPIs that will tell you if you're succeeding.
Beyond these general metrics, it's smart to track key customer engagement metrics that show a deeper connection to your business goals. This is how you build a complete picture of your performance.
Ultimately, your social media analytics should be a custom-built machine. When you move past generic vanity metrics and start choosing KPIs tied directly to business outcomes, platform quirks, and specific campaign goals, you stop just counting numbers. You start building a strategic roadmap for growth.
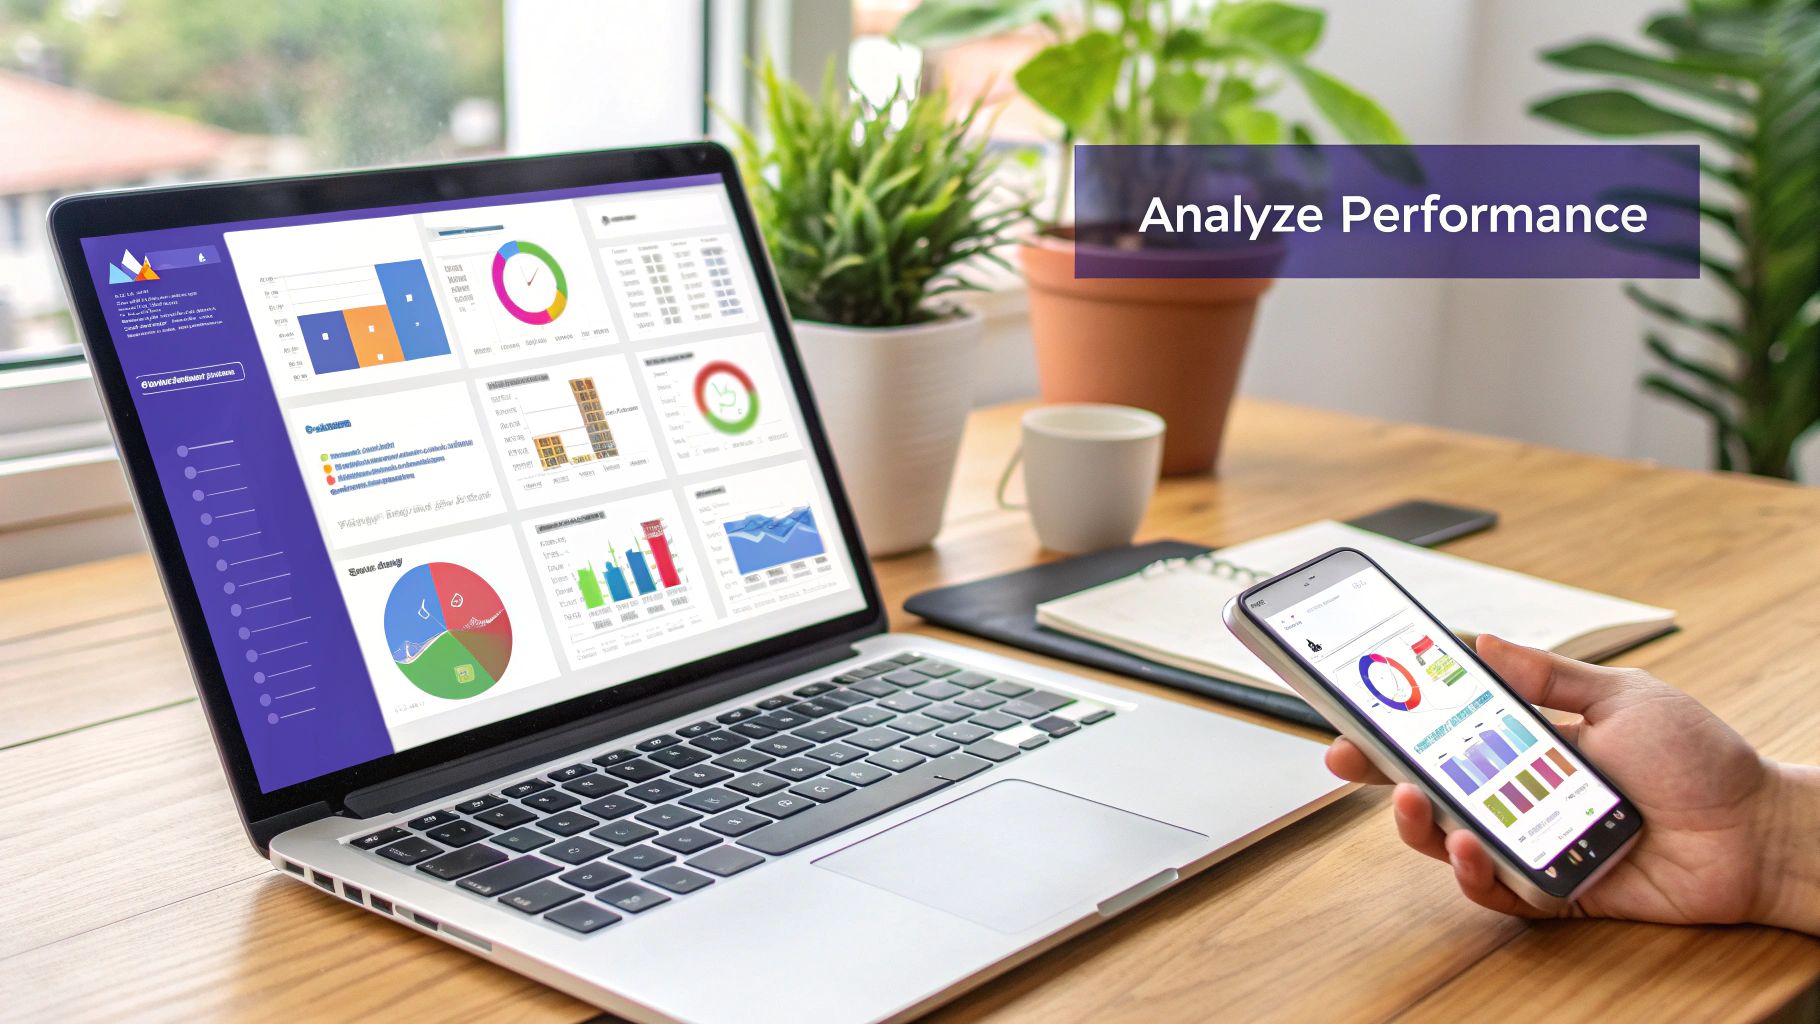
Using Modern Tools to Gather and Analyze Data
Let's be real: great social media reporting starts with great data. But if you're still manually exporting spreadsheets from every single social network, you're working way too hard for subpar results. That old-school approach isn't just slow and packed with potential errors; it leaves you with a fractured, incomplete view of what’s actually working.
Modern analytics platforms have completely changed the game. Think of them as a central command center, automatically pulling data from all your social profiles into one place. This lets you stop wasting hours on tedious data entry and start spending that time on what actually moves the needle: analysis and strategy.
For example, a tool like PostSyncer can sync directly with Facebook, Instagram, X (formerly Twitter), LinkedIn, and more. Suddenly, you're not juggling five different native analytics tabs anymore. Instead, all your key metrics are right there in a single, cohesive view. This is the first, crucial step toward truly powerful social media analytics and reporting.
The Power of Centralized Data
Getting all your data under one roof does a lot more than just save you a few hours. It unlocks a much deeper level of analysis that’s frankly impossible when your data is scattered across different platforms.
With a centralized dashboard, you can finally:
- Compare cross-channel performance at a glance and see which networks are giving you the best bang for your buck on specific campaigns.
- Track big-picture brand metrics like total engagement, overall reach, and follower growth across your entire social media presence.
- Spot your star content universally, no matter which platform it was originally posted on.
This unified view is absolutely essential for understanding your strategy holistically. You can start connecting the dots, like seeing how a viral video on TikTok might be driving brand conversations over on X. To get a better sense of this in action, check out our guide on building a powerful social media analytics dashboard.
When your data lives together, you can finally ask bigger, more strategic questions. Instead of just asking, "How did this Instagram post do?" you can start asking, "How is our video content performing as a whole across all channels?"
That shift in perspective is what separates basic reporting from genuine strategic analysis.
Uncovering Insights with AI and Machine Learning
The biggest leap forward in social media analytics tools has been the integration of artificial intelligence (AI) and machine learning (ML). These aren't just buzzwords; they are powerful engines working behind the scenes to automate complex analysis and surface insights you'd probably miss on your own.
AI-powered features can chew through thousands of data points in real time to hand you actionable intelligence.
- Sentiment Analysis: AI can automatically scan comments and mentions to tell you if the buzz around your brand is positive, negative, or neutral. Imagine launching a product and instantly seeing a 15% spike in positive sentiment—that's a clear win, telling you the message landed perfectly.
- Predictive Trend-Spotting: By analyzing conversation patterns, some tools can even predict which topics or hashtags are about to blow up in your industry. This allows you to jump on trends proactively instead of just chasing them.
- Audience Segmentation: AI can automatically sort your audience into distinct groups based on behavior, interests, and demographics, which is a massive help for tailoring your content.
These advanced capabilities are no longer just for massive corporations with bottomless budgets. The demand for better business intelligence has fueled incredible growth and innovation in this space. The social media analytics market is on track to hit around USD 43.25 billion soon, largely thanks to the widespread adoption of AI and ML for digging deeper into customer and competitor behavior.
This accessibility means businesses of all sizes can now use these sophisticated tools to make smarter, data-backed decisions. When you embrace a modern analytics platform, you’re not just getting a better reporting tool—you’re getting a strategic partner that helps you find the story hidden in your data.
Crafting Social Media Reports That Tell a Story
Let’s be real. Data is just a bunch of noise until you give it a voice. A social media report packed with endless charts and metrics nobody understands isn't just useless—it’s a colossal waste of everyone’s time. The whole point of social media analytics and reporting is to transform that raw data into a story that actually helps you make smarter decisions.
A truly effective report does more than just throw numbers on a page; it interprets them. It has to answer three simple, yet critical, questions for anyone reading it:
- What happened? (The bottom-line results and performance data)
- Why did it happen? (The analysis and context that explain those numbers)
- What should we do next? (Clear, strategic recommendations for the future)
When you frame your report this way, it stops being a boring data dump and becomes an indispensable tool for making decisions. It’s how you get your team on board, justify your budget, and constantly improve your strategy with real evidence instead of just guessing.
Tailoring the Narrative to Your Audience
Not everyone on your team needs to see the same firehose of data. A report for your CEO should look completely different from the one you pass to your content creators. Customizing the story for the person reading it is the secret to making sure your insights actually stick and lead to action.
For Executives (The C-Suite): Keep it high-level. They care about business impact, period. Your report needs a sharp executive summary that directly connects social media activity to big-picture goals like revenue, lead generation, and brand health. Think visuals that show ROI, cost per acquisition, and your slice of the market share.
For the Marketing Team (Your Peers): Now you can get into the weeds. This is where you dive deep into campaign-specific metrics, A/B test results, and breakdowns of content performance. This group needs the nitty-gritty details to figure out what’s working on a daily basis and how to optimize their next moves.
For the Content Team (The Creators): Focus on what sparks creativity. Highlight which topics, formats (like Reels vs. carousels), and messaging styles are hitting home with your audience. This report should be their inspiration, showing them exactly what people want to see more of.
By tailoring the report, you make sure everyone gets exactly what they need in a way they can instantly understand and act on.
Before you can report, you need to know what you're measuring. The KPIs you choose should be a direct reflection of your business goals. A startup trying to build brand awareness will track very different metrics than an established e-commerce brand focused on driving sales.
Here’s a quick breakdown of how business objectives map to specific KPIs:
KPIs by Business Objective
| Business Objective | Primary KPIs | Supporting Metrics |
|---|---|---|
| Increase Brand Awareness | Reach, Impressions, Audience Growth Rate | Mentions, Share of Voice |
| Drive Website Traffic | Clicks, Click-Through Rate (CTR) | Traffic from Social, Bounce Rate |
| Generate Leads | Leads Generated, Conversion Rate, Cost Per Lead (CPL) | Form Fills, Gated Content Downloads |
| Boost Engagement | Engagement Rate, Likes, Comments, Shares | Post Interactions, Virality Rate |
| Improve Customer Service | Response Rate, Response Time, Customer Satisfaction (CSAT) | Resolution Rate, Sentiment Analysis |
This table isn't exhaustive, but it's a solid starting point for aligning your social media efforts with what truly matters to the business. Choose the metrics that tell the most important part of your story.
Visualizing Data for Maximum Impact
How you present your data is just as crucial as the data itself. Smart data visualization can make complex information digestible at a glance, immediately drawing the eye to key trends and important takeaways.
To really nail the storytelling aspect of your reports, you have to get good at visualization. It's worth exploring some of the top data visualization best practices to learn how to build charts and graphs that are both beautiful and incredibly insightful. Simple things like clear labels, a consistent color palette, and enough white space can prevent your audience from feeling overwhelmed.
Take this chart, for example. It compares the efficiency of automated API integration against manual data exports for reporting.
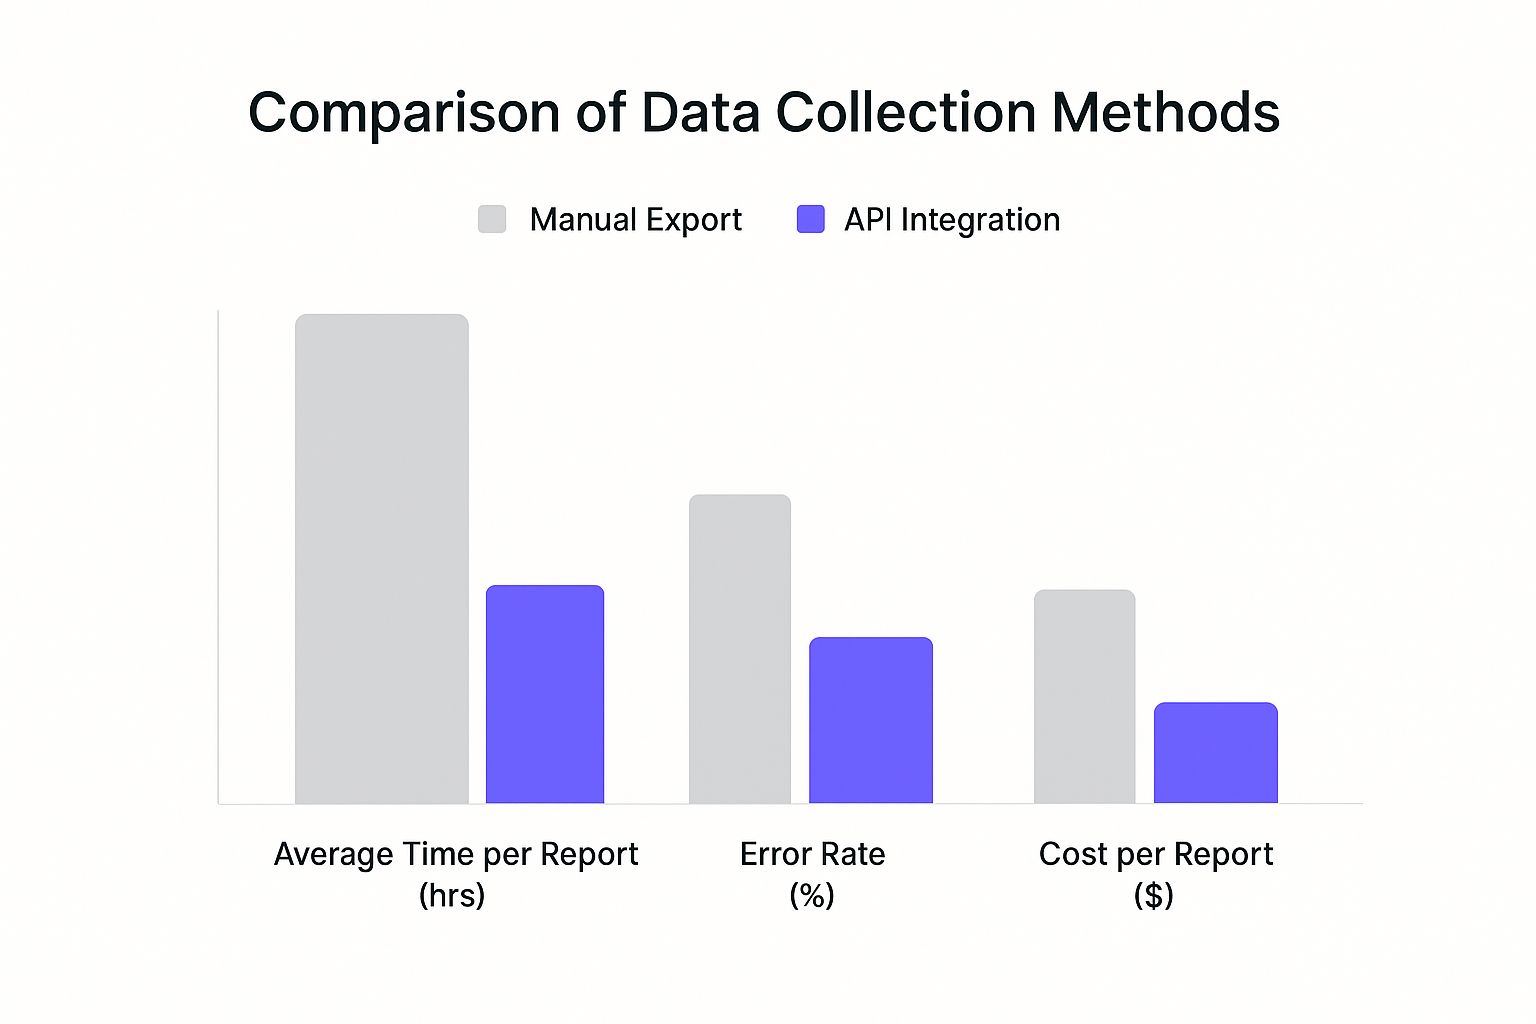
You can see instantly that while manual methods might seem cheaper at first, their high error rates and the sheer time they consume make them far less efficient and trustworthy than a solid API integration.
Adding Qualitative Context to the Numbers
Your data tells you what happened, but it almost never tells you why. That’s where qualitative context becomes your secret weapon. Numbers alone can be seriously misleading. A huge spike in engagement might look fantastic on a chart, but if it came from a storm of negative comments, the story changes completely.
A great report blends quantitative data (the numbers) with qualitative insights (the human story). Don't just show a chart of your top-performing posts; explain why they performed well.
Was it because of a really compelling customer story? Did you jump on a viral trend at the perfect time? Or did a new video style just connect with people on an emotional level? Adding this narrative layer is what provides the rich context needed for genuine understanding. For a deeper dive, our article on how to measure social media success has more strategies for connecting data points to real-world results.
Ultimately, building a social media report that tells a story is about moving beyond raw data to deliver meaning. When you frame your report with a clear narrative, customize it for your audience, visualize your data well, and enrich it with context, you create a powerful tool that doesn't just inform—it inspires action and pushes your whole strategy forward.
Turning Insights Into a Smarter Social Strategy
Gathering data is just the starting line. A gorgeous, perfectly formatted social media report doesn't mean a thing if it just gathers digital dust in a folder. The real work—and the real magic—of social media analytics and reporting begins when you connect the dots between the numbers on your screen and the strategic moves you make next.
The goal is to build a feedback loop where every insight you uncover directly shapes a smarter, more powerful strategy.
It's all about turning the what into the so what. Your report might show a video went viral, but the gold is in understanding why. Was it the high-energy soundtrack? The lightning-fast cuts? The relatable story you told? Answering these questions is how you stop reacting to past performance and start proactively shaping your future success.
Think of your social media reports less like a report card and more like a detailed instruction manual for what to do next. Every chart, metric, and trend is a clue telling you exactly what your audience craves.
This shift in mindset is everything. You're no longer just clocking in to measure performance; you're on the hunt for growth levers. The entire social media analytics market, which is on track to hit USD 61.95 billion, is built on this very idea: using data to make better business decisions. The money pouring into this space proves that the smartest brands are using analytics for everything from product tweaks to customer service.
From Report Findings to Real-World Actions
So, how do you actually do it? How do you take a finding from your PostSyncer dashboard and turn it into a concrete action? It all starts by spotting patterns and asking the right questions.
Let’s get practical with a few real-world scenarios:
You Find a Content Goldmine: Your report shows carousels featuring user-generated content (UGC) consistently pull in 3x more saves than your slick, branded graphics.
- The Action: You immediately decide to make UGC a central part of your content strategy. You launch a new campaign asking followers to share photos using a specific hashtag, creating a fresh, authentic stream of content you can feature.
You Pinpoint Your Prime Time: After looking at your analytics, you notice a massive engagement spike every Thursday between 6 PM and 8 PM.
- The Action: You use PostSyncer’s scheduler to move all your most important posts into that prime-time slot. You'll run this for a few weeks to see if your average engagement rate ticks up.
You Spot an Emerging Interest: Your sentiment analysis tools show a surprising number of positive comments about your brand's sustainability initiatives, even though you rarely talk about them.
- The Action: You realize you've struck a chord. You plan a dedicated content series that dives deep into your eco-friendly practices, giving your audience more of what they're clearly interested in.
Each example draws a straight line from a single data point to a smart strategic decision. It's a simple, repeatable process that ensures your strategy is guided by real audience feedback, not guesswork.
Systematizing Your Learning with A/B Testing
Once your analytics give you a solid hypothesis—like, "shorter video captions get more views"—it's time to put it to the test. A/B testing is your best friend for this. It’s a simple method for comparing two versions of a post to see which one gets better results.
Don't overthink it. You can set up an A/B test for almost anything:
- Headlines: "5 Ways to Boost Productivity" vs. "Unlock Your Most Productive Self"
- Visuals: A photo of a person vs. a colorful animated graphic
- Calls-to-Action (CTAs): "Learn More" vs. "Get the Guide"
- Post Format: A single video vs. a multi-image carousel
The golden rule is to only change one thing at a time. If you change both the image and the caption, you’ll have no idea which element made the difference. Run your test, measure the results in your analytics dashboard, and let the data tell you which version won. That winning approach becomes your new best practice—until you test something else. To get a comprehensive view of what to evaluate, dig into the key areas of a social media audit.
Building a Continuous Improvement Cycle
Ultimately, the goal is to create a self-powering cycle of improvement. This process transforms your social media from a bunch of one-off campaigns into a cohesive system that learns and gets better over time.
It looks something like this:
- Plan & Execute: Build your content calendar and run your campaigns based on what you currently know works best.
- Measure & Analyze: Use your reporting tools to collect data and figure out what worked, what flopped, and why.
- Report & Interpret: Turn those findings into a clear story, pointing out the most important insights and patterns.
- Adapt & Optimize: Convert those insights into your next set of actions—tweaking your content, refining your tactics, and A/B testing new ideas.
This loop guarantees your strategy never goes stale. Each reporting period delivers fresh intel to fuel the next cycle, making your social media sharper and more impactful over time. And to make this cycle run smoothly, you need the right toolkit. You can check out our top picks in this guide to social media reporting tools.
Even with the best tools in hand, the world of social media analytics can feel like a maze. It's totally normal to have questions pop up as you dig into your data, and getting clear answers is what separates a confusing spreadsheet from a winning strategy.
Let's walk through some of the most common questions we hear from marketers on the ground. The goal here is to cut through the noise and give you the confidence to make your data work for you.
How Often Should I Run Social Media Reports?
There's no magic number here. The right reporting frequency depends entirely on what you’re trying to achieve and, just as importantly, your team's ability to actually use the information. A frantic daily report is worthless if no one has time to read it.
The key is to match your reporting cadence to your decision-making cycle. Here’s a simple framework that I’ve seen work for countless teams:
- Weekly Reports: These are your go-to when you're in the middle of a specific, time-sensitive campaign. A weekly check-in gives you just enough time to make smart, tactical pivots—like shifting ad spend or swapping out a low-performing creative—before it's too late. Think of it as your campaign's real-time pulse.
- Monthly Reports: This is the sweet spot for tracking your overall strategy. A monthly view helps you see the bigger picture and spot trends without getting lost in the daily noise. It’s perfect for answering larger questions about which content pillars are resonating or how your audience is growing over time.
- Quarterly & Annual Reports: Save these for the big-picture conversations with leadership and key stakeholders. The focus shifts to long-term ROI, progress against major business goals, and making informed decisions about future strategy and budgets.
Ultimately, the best rhythm is the one that gives your team actionable insights when they need them.
What Is the Difference Between Social Media Analytics and Reporting?
This is a fantastic question because people throw these terms around interchangeably, but they are two very different—and equally vital—parts of the process. I like to think of them as two sides of the same coin.
Analytics is the investigation. It's the messy, curious part where you roll up your sleeves, dive into the raw data, and ask "Why?" You're hunting for patterns, outliers, and the story hidden behind the numbers.
Reporting is the communication. This is where you take all those fascinating discoveries from your analysis and package them into a clear, compelling narrative. Reporting organizes and visualizes your findings to answer the "what" and "so what" for your audience.
You simply can't have great reporting without doing the analytical legwork first.
Which Are the Most Important Metrics for B2B vs. B2C?
While some metrics like engagement rate are universally helpful, your business model completely changes the game. What signals success for a B2B software company is worlds away from what a B2C fashion brand needs to track.
For B2B (Business-to-Business): The sales cycle is longer, and the focus is on building trust, demonstrating expertise, and generating high-quality leads.
- Your Top KPIs: Conversion rates on lead magnets (like whitepapers or webinar sign-ups), click-through rates to case studies, and audience growth on professional networks like LinkedIn.
- Why they matter: These metrics prove you're establishing thought leadership and successfully moving potential clients from discovery into your sales funnel.
For B2C (Business-to-Consumer): It's often about building a vibrant community, driving brand awareness, and converting followers into customers, sometimes on impulse.
- Your Top KPIs: Reach and impressions, customer sentiment, the amount of user-generated content (UGC) you inspire, and e-commerce conversion rates tied directly to social posts.
- Why they matter: These numbers show you're building a loyal brand following and effectively turning social engagement into sales.
How Can I Prove the ROI of My Social Media Efforts?
Ah, the million-dollar question. Proving return on investment is how you justify your budget, earn a seat at the table, and show your true value to the business. The trick is to draw a clear, undeniable line from your social activities to real business results.
Here are a couple of tried-and-true methods:
Become a UTM Master: Get into the habit of using UTM parameters on every single link you share. These simple tags let tools like Google Analytics tell you exactly how much traffic, how many leads, and even how much revenue came from a specific social media campaign or post. You can then stack that value up against what you spent on tools, ads, and your time. It’s the most direct way to connect the dots.
Show the Cost Savings: ROI isn't always about new money coming in; it can also be about money you've saved. For instance, can you show that your stellar social media customer service has led to a drop in support calls? Did you use amazing follower-submitted photos (UGC) for a campaign, slashing your content creation budget? Framing these as "value-added" contributions paints a much fuller picture of your impact.
Ready to stop guessing and start making data-driven decisions with confidence? PostSyncer gives you a central dashboard to track all these metrics, build custom reports for any stakeholder, and find the insights you need to prove your ROI.